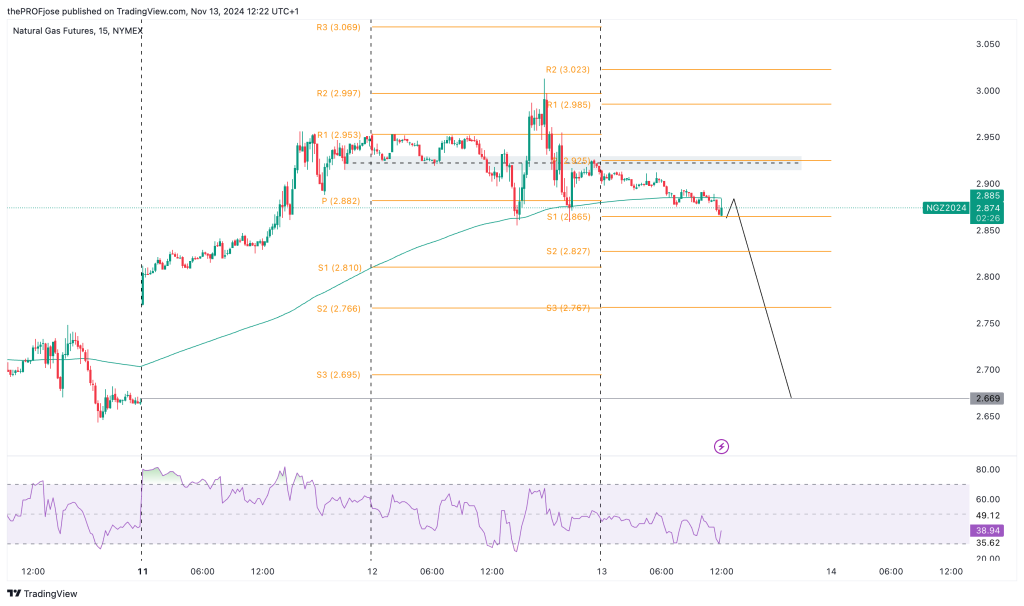
Natural Gas prices initially rallied but then fell as warmer U.S. temperatures lowered heating demand, contributing to high inventory levels.
Key Points
- Tuesday’s -1.07% dip reflects bearish sentiment, though European prices provided slight support.
- U.S. gas production and demand dropped, but LNG export flows rose on strong international demand.
- High U.S. and European storage levels keep a bearish outlook on Natural Gas prices.
Natural Gas Daily Price Analysis – 13/11/2024
Natural Gas prices saw a slight uptick early this week, only to pull back by Tuesday, driven by changing weather forecasts and supply dynamics. The initial rally, which pushed December futures to a six-week high, lost momentum as warmer-than-expected temperatures across the U.S. reduced the demand for heating. This shift in temperature has contributed to ample gas inventories, a bearish influence on NG prices, despite some supportive forecasts indicating a potential cold spell in central U.S. regions around late November, which could bolster heating demand.
Today’s -1.07% dip from the open reflects market sentiment, leaning bearish amid continued high inventories and mild weather, dampening the outlook for NG demand in the immediate term. European gas prices also impacted U.S. markets by lifting sentiment slightly, reaching their highest point in nearly a year due to regional demand and supply concerns.
Supply and Demand
On Tuesday, dry gas production in the U.S. Lower 48 states was recorded at 98.7 bcf/day, a -7.1% decline year-over-year. Demand in the same region also showed a -6.1% annual drop, reported at 77.6 bcf/day. The reduction in both production and demand suggests a market balance that may prevent extreme volatility, though ample supply in the system keeps a lid on price spikes.
U.S. LNG export terminals saw net flows of 13.4 bcf/day, marking a +3.0% week-on-week increase. This uptick in LNG export flows underscores solid international demand for U.S. gas, which could play a supportive role for prices should domestic supply balance tighten or international demand intensify, especially as winter sets in across Europe.
Increased U.S. electricity output is contributing positively to NG demand. The Edison Electric Institute reported that electricity output in the Lower 48 states for the week ending November 2 rose +1.24% year-over-year to 73,690 GWh. Over the 52-week period, output was up by +1.56%, indicating that while natural gas remains a pivotal source for electricity generation, these gains alone have not been substantial enough to counteract the overall bearish inventory and demand trends.
Inventory Analysis
The weekly EIA report, released last Thursday, indicated a robust +69 bcf build in NG inventories for the week ending November 1. This build exceeded the +68 bcf expected and was significantly higher than the 5-year average of +32 bcf. As of November 1, inventories were 4.2% higher year-over-year and 5.8% above their 5-year seasonal average, showcasing ample supply.
In Europe, gas storage levels are at 93% of capacity, surpassing the 5-year average of 92%. These elevated storage levels in both U.S. and European markets reinforce a bearish sentiment, as supply remains more than adequate to meet anticipated winter demand, especially if milder weather patterns persist.
Drilling and Rig Count
The latest Baker Hughes report showed that the number of active U.S. natural gas rigs remained steady at 102, slightly above the 3-1/3-year low reached in early September. This consistent rig count reflects a conservative production outlook, given subdued price trends and the already high inventory levels. While rig counts remain higher than pandemic-era lows, they have dropped considerably from the peak levels of 2022, indicating a cautious approach from producers in response to current price dynamics.
Key Economic Data and News to Be Released Today
On the US Dollar front today, the Core CPI is expected at 0.3%, aligning with the previous month’s value. While the CPI m/m is forecasted to remain at 0.2%, signaling stable month-over-month inflation.
If CPI data comes in higher than expected, it could increase the likelihood of a more hawkish Federal Reserve stance, potentially strengthening the U.S. dollar. A stronger dollar can exert downward pressure on commodity prices, including Natural Gas, as it makes dollar-denominated commodities more expensive for international buyers, thereby potentially reducing demand.
However, stable or lower-than-expected CPI readings may support current Fed policy, limiting dollar strength and potentially benefiting Natural Gas prices by keeping commodity costs steady.
Natural Gas Technical Analysis – 13/11/2024
Currently, the price action on Natural Gas is quite messy, with the price giving an unclear signal, especially with the 200 EMA. While the price is currently below the 200 EMA, we want to see a decisive close below the moving average before determining to short the market.

In the meantime, the price is approaching key support levels, and the RSI is oversold. While these may signal a bullish retracement or reversal, the bearish momentum seems to be quite strong, and we may see the price dip further today and for the rest of the week.
Natural Gas Fibonacci Key Price Levels 13/11/2024
Short-term traders planning to invest in NG today should keep a close eye on the following key price levels for the day:
| Support | Resistance |
| 2.865 | 2.985 |
| 2.827 | 3.023 |
| 2.767 | 3.083 |
Risk Disclosure: The information provided in this article is not intended to give financial advice, recommend investments, guarantee profits, or shield you from losses. Our content is only for informational purposes and to help you understand the risks and complexity of these markets by providing objective analysis. Before trading, carefully consider your experience, financial goals, and risk tolerance. Trading involves significant potential for financial loss and isn't suitable for everyone.


