The U.S. Energy Information Administration reported a 0.7% increase in supply and a 0.9% rise in consumption, driven by a sharp 14% jump in residential and commercial demand, while power generation demand fell 7.5%.
Key Points
- Natural gas prices rose to $3.394/MMBtu today, up 1.65% after a 4.57% surge on Thursday.
- Gas stocks are 3,969 Bcf, 239 Bcf above the five-year average, ensuring robust supply.
- Cold weather forecasts for December are driving heating demand and prices higher.
Natural Gas Daily Price Analysis – 22/11/2024
Natural gas prices have demonstrated a significant upward trend recently. Thursday’s close at $3.339/MMBtu marked a 4.57% increase from the opening price of $3.216, reflecting heightened market activity. As of today, prices have climbed further to $3.394, representing a 1.65% increase from the opening price of $3.390.
Several interconnected factors are driving these price movements. The U.S. Energy Information Administration reported a 0.7% week-over-week rise in natural gas supply, primarily due to an increase in dry natural gas production. Simultaneously, consumption rose by 0.9%, with a sharp 14% jump in residential and commercial demand.
However, this increase was partially offset by a 7.5% decline in natural gas usage for power generation. Despite this, net withdrawals from storage totaled 3 Bcf for the week ended November 15, leaving total working gas stocks at 3,969 Bcf. This is 239 Bcf above the five-year average and 141 Bcf higher than the same period last year, underscoring ample supply in the market.
The weather outlook has also played a critical role in bolstering prices. Forecasts for colder-than-average temperatures across much of the United States for the December 1-5 period have spurred expectations of increased heating demand, adding upward pressure. Geopolitical developments, including escalations in the Ukraine-Russia conflict, have further fueled market uncertainty.
Russia’s recent missile strikes on Ukraine and the U.S. sanctioning of Gazprombank heightened concerns about potential disruptions in Russian gas flows to Europe, a factor that has driven European gas prices to a one-year high. International markets echo this sentiment, with LNG prices rising by $0.63 to $14.17/MMBtu in East Asia and by $0.90 to $14.38/MMBtu at the Title Transfer Facility in Europe.
Despite these bullish indicators, there are moderating forces to consider. Ample U.S. storage levels and potential fluctuations in power generation demand could temper the rally. Additionally, the EIA noted that while U.S. gas inventories fell by 3 Bcf last week, this is significantly less than the five-year seasonal average withdrawal of 16 Bcf, suggesting a robust supply cushion. Meanwhile, Baker Hughes reported a modest decrease in active U.S. natural gas drilling rigs, down by one to 101 rigs, hinting at restrained production growth.
Key Economic Data and News to Be Released Today
There are no high-impact economic data releases specifically expected to influence natural gas prices today. Market participants will continue to monitor weather forecasts, geopolitical developments, and any unexpected changes in U.S. or European energy policies.
Natural Gas Technical Analysis – 22/11/2024
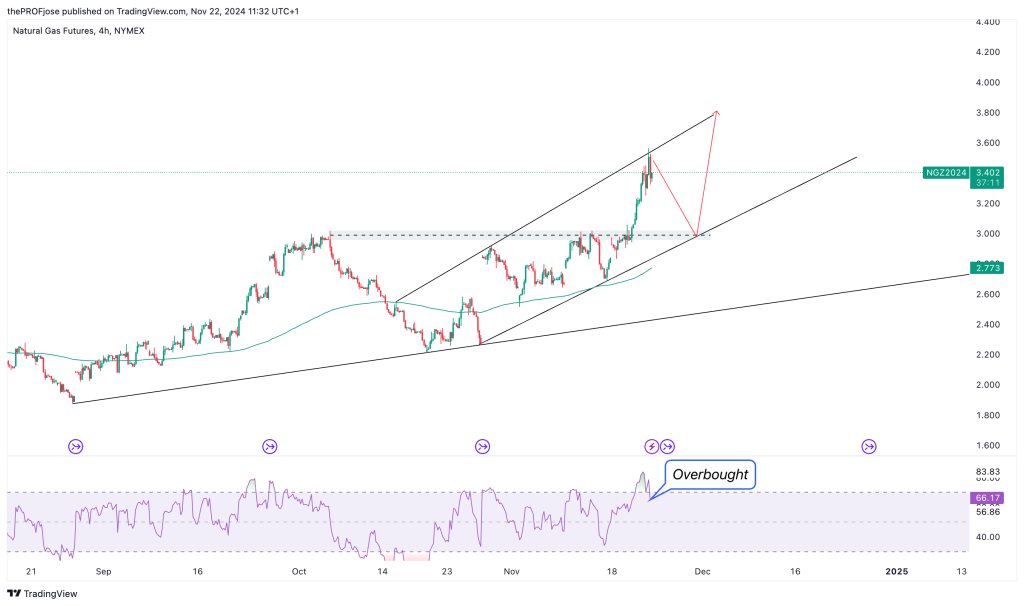
Natural Gas prices have been soaring high for a couple of months now. On the 4-hour timeframe, price is riding seamlessly in a bullish channel, giving us a series of higher highs and higher lows. At the moment, price has hit the resistance level of the rising channel, while the RSI also shows that price is overbought.

What does this mean? Simply put, while the overall price direction is still bullish, we may have a brief retracement to another key level as shown in the chart above before price can continue its upward movement.
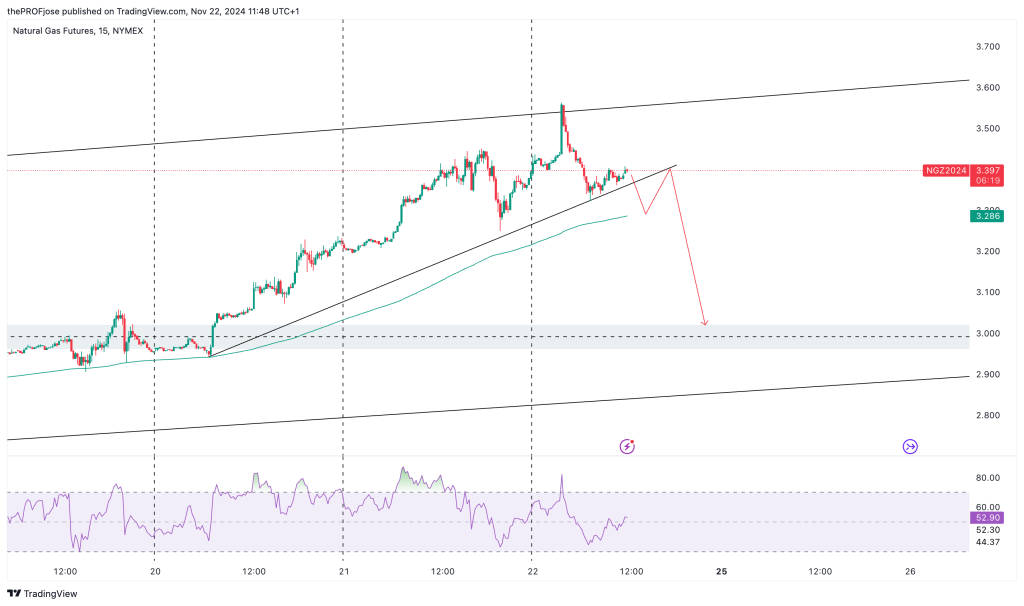
While this retracement may look insignificant on the 4-hour timeframe, it can be a massive move when we scale down to the 15-minute timeframe. That’s the power of multi-timeframe analysis.

To take advantage of this retracement, it is better to keep an eye on the trendline shown in the 15-minute chart above. If price breaks below this line and retest it, while also giving us a bearish candlestick confirmation, it’s time to short. Better still, if you can wait for price to also cross the 200 EMA to the downside before shorting the market, the trade has much more probability of playing out because the sentiment has now switched bearish.
Natural Gas Fibonacci Key Price Levels 22/11/2024
Short-term traders planning to invest in NG today should keep a close eye on the following key price levels for the day:
| Support | Resistance |
| 3.231 | 3.426 |
| 3.170 | 3.487 |
| 3.072 | 3.584 |
Risk Disclosure: The information provided in this article is not intended to give financial advice, recommend investments, guarantee profits, or shield you from losses. Our content is only for informational purposes and to help you understand the risks and complexity of these markets by providing objective analysis. Before trading, carefully consider your experience, financial goals, and risk tolerance. Trading involves significant potential for financial loss and isn't suitable for everyone.


