
U.S. robust GDP growth is supporting natural gas demand, while European mild weather forecasts are expected to reduce demand pressures, and hot weather in Asia is increasing LNG consumption.
Key Points
- Natural gas prices rose 2.03% yesterday, closing at $2.336 due to a weaker impact from Hurricane Beryl.
- Prices fell 0.38% today, opening at $2.373 and dropping to $2.356 as supply concerns eased.
- Fed Chair Powell’s testimony and U.S. natural gas storage data are key economic events influencing prices today.
Natural Gas Daily Price Analysis – 09/07/2024
On the previous trading day natural gas prices had made a significant increase, They wrapped up at $2.336 and opened for trades around $2.270 per mmbtu reflecting an escalation of 2.03%. This increase was partly a result of market dynamics, including the weaker impact on U.S. supplies from Hurricane Beryl. It ended up causing less damage than expected when it made landfall on the Texas coast. As a result, Freeport LNG moved to reduce production at its terminal — though the facility should resume normal operations in short order — while gas flows to other major terminals like Corpus Christi and Sabine Pass were unaffected.
To begin the current trading day natural gas opened at $2.373 only to fall as low as $2.356 which represents a 0.38% move lower thus far on the session. The decline is also due to supply worries easing and some rebalancing after the initial hurricane disruptions are now over. In addition, global natural gas pricing trends have varied by region. Amid weak demand the prices of European natural gas futures dropped to €32 per MWh, whereas Asian LNG stays pressured upwards by higher than normal temperatures there.
The recent price movements are also shaped by broader economic indicators. In the U.S., robust GDP growth is bolstering natural gas demand, countering the bearish pressure from high interest rates. In contrast, mild weather forecasts for major European markets are expected to alleviate demand pressures, while hot weather in Asia continues to strain power grids, particularly in Tokyo, leading to increased LNG consumption.
Key Economic Data and News to Be Released Today
Today, several high-impact economic events are anticipated to further influence natural gas prices. Key among them is the testimony from Fed Chair Powell, which could provide insights into future monetary policy and its implications for energy markets. Additionally, data on U.S. natural gas storage levels will be closely watched, as it could signal supply and demand dynamics in the near term. Market participants should also monitor any developments related to hurricane impacts on production facilities, as further disruptions could create volatility in prices.
Natural Gas Technical Analysis – 09/07/2024
Currently, the price being below the 200 EMA suggests that the long-term trend remains bearish. Also, the RSI near oversold levels hints at a potential short-term bounce or consolidation.
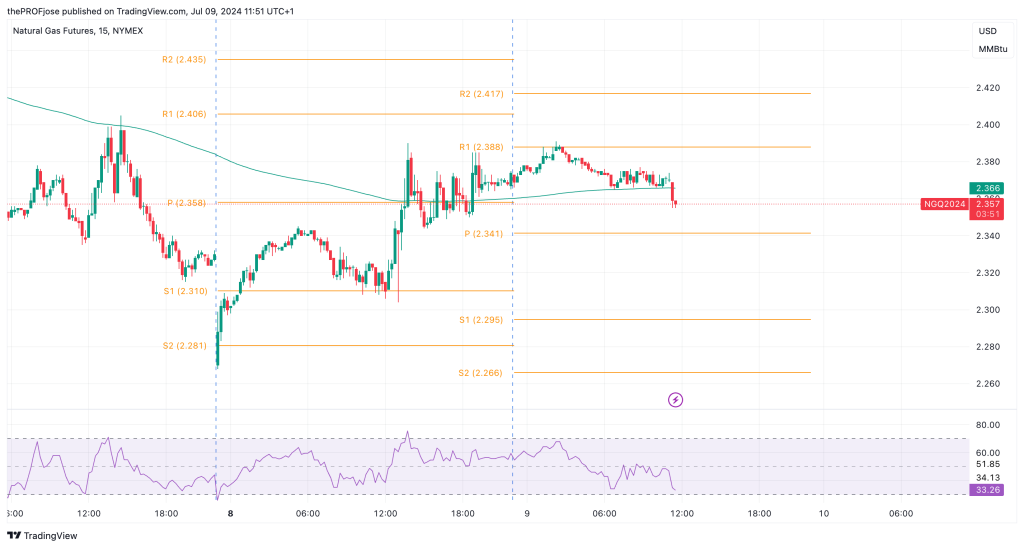
In the short term, natural gas prices are likely to remain under pressure, with a potential for a minor rebound due to the oversold RSI. Traders should watch the pivot level closely; sustaining above it could lead to a retest of higher resistance levels, while failing to hold could result in further declines to the support levels.
Natural Gas Fibonacci Key Price Levels 09/07/2024
Short-term traders planning to invest in NG today should keep a close eye on the following key price levels for the day:
| Support | Resistance |
| 2.295 | 2.388 |
| 2.266 | 2.417 |
| 2.219 | 2.463 |
Risk Disclosure: The information provided in this article is not intended to give financial advice, recommend investments, guarantee profits, or shield you from losses. Our content is only for informational purposes and to help you understand the risks and complexity of these markets by providing objective analysis. Before trading, carefully consider your experience, financial goals, and risk tolerance. Trading involves significant potential for financial loss and isn't suitable for everyone.