


Weather models predicting above-normal temperatures from October 21-25 dampened natural gas demand as the need for heating decreased.
Key Points
- U.S. gas demand rose 3.7% year-over-year, while production was 100.9 bcf/day.
- Inventories increased by +82 bcf, but ample supply keeps prices bearish.
- LNG exports grew 6.2%, while U.S. drilling rigs fell slightly to 101.
Natural Gas Daily Price Analysis – 17/10/2024
Natural Gas prices experienced a significant drop on Wednesday, with November contracts (NGX24) closing at $2.367, down by -5.24%. This marks a sharp decline, primarily driven by updated forecasts indicating milder weather across most of the U.S. during late October. As of today, natural gas opened at $2.377 and currently trades at $2.364, representing a marginal decline of -0.21%.
Weather Impact and Demand
One of the primary catalysts for the sharp decline in natural gas prices is the shift in weather models. Experts predict above-normal temperatures for the U.S. from October 21-25, reducing the need for heating and consequently dampening natural gas demand. Historically, this time of year typically experiences an increase in natural gas demand as temperatures cool. However, the prospect of milder autumn conditions is leading traders to price in lower demand.
Despite the short-term weather-related dip in demand, there are factors that suggest underlying strength in the natural gas market. Lower-48 state dry gas production on Wednesday stood at 100.9 bcf/day, which is a year-over-year decline of -2.8%. On the other hand, Lower-48 state gas demand reached 76 bcf/day, a notable 3.7% increase year-over-year. This uptick in demand, especially from electricity providers, offers some support for natural gas prices.
Inventory and Supply Dynamics
Natural gas inventories remain robust, with recent EIA data showing that stockpiles increased by +82 bcf in the week ending October 4, which was higher than the market’s expectation of +71 bcf. This build-up is still below the five-year average increase of +96 bcf for this period, indicating a slower-than-expected injection rate. However, natural gas inventories remain elevated, with stockpiles 5.1% above their five-year seasonal average. As of October 4, inventories were up +2.8% year-over-year.
Additionally, European natural gas storage is reported to be 95% full as of October 13, further reducing the global demand for U.S. exports. This abundant supply, both domestically and internationally, is likely to keep downward pressure on prices in the near term.
U.S. LNG Exports and Drilling Activity
Liquefied Natural Gas exports remain strong, with net flows to the U.S. LNG export terminals reaching 13.2 bcf/day, a +6.2% increase from the previous week. This steady export activity highlights continued demand for U.S. natural gas in global markets, even as domestic prices fluctuate due to weather forecasts and inventory levels.
Meanwhile, the number of active U.S. natural gas drilling rigs has fallen slightly. Baker Hughes reported a reduction of -1 rig, bringing the total count to 101 rigs, just above the three-year low of 94 rigs seen in September. While this drop in drilling activity suggests some restraint in supply growth, it is not enough to offset the current bearish sentiment in the market.
Key Economic Data and News to Be Focus On
Today’s key economic release is the weekly EIA natural gas storage report. Analysts expect a build of +76 bcf, slightly below the 5-year average of +96 bcf. Market participants will closely monitor this report as any surprises—either a smaller or larger build than expected—could influence price movements.
Further updates from weather forecasting services like Atmospheric G2 will be crucial. Any shifts towards colder temperatures could offer some relief to natural gas prices, particularly if the warm-weather projections for late October are revised.
Natural Gas Technical Analysis – 17/10/2024
NG is heavily bearish at the moment, although the Relative Strenght Index (RSI) indicator hit the oversold level earlier in the session. Nevertheless, the price may only retrace briefly and continue its downward movement.
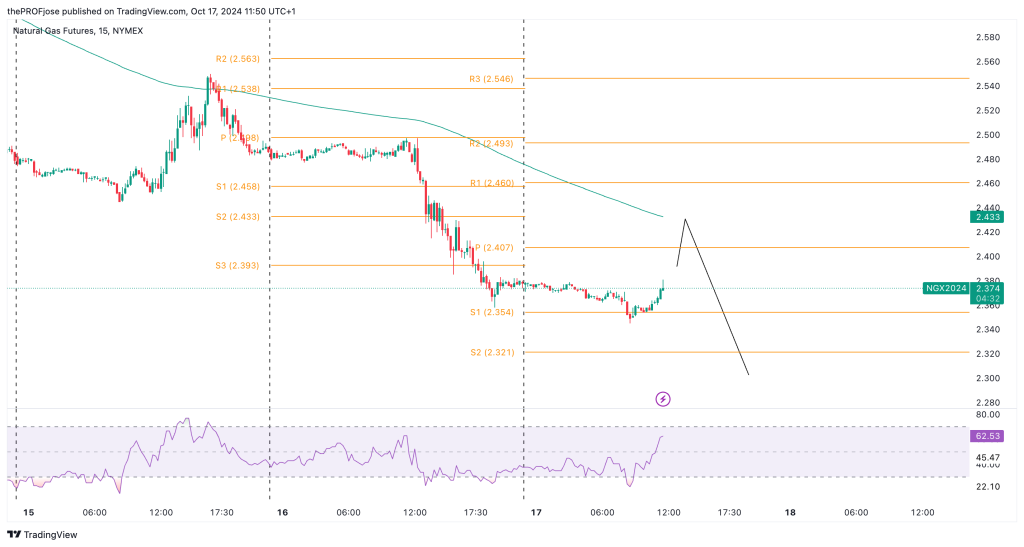
A closer look at the chart above shows that the price is trending smoothly below the 200 EMA while the price is approaching the moving average for a rebound. Similarly, the RSI is approaching the overbought level, indicating the short bullish retracement may be ending soon, and the price might continue its bearish movement.
Natural Gas Fibonacci Key Price Levels 17/10/2024
Short-term traders planning to invest in NG today should keep a close eye on the following key price levels for the day:
| Support | Resistance |
| 2.354 | 2.460 |
| 2.321 | 2.493 |
| 2.268 | 2.546 |
Risk Disclosure: The information provided in this article is not intended to give financial advice, recommend investments, guarantee profits, or shield you from losses. Our content is only for informational purposes and to help you understand the risks and complexity of these markets by providing objective analysis. Before trading, carefully consider your experience, financial goals, and risk tolerance. Trading involves significant potential for financial loss and isn't suitable for everyone.