


Mixed production and demand trends show U.S. dry gas production down 1.3% year-over-year, while demand has surged by 11.7% from electricity providers.
Key Points
- Natural Gas prices fell 0.13% on Friday, following a 2.80% rise on Thursday.
- Warmer U.S. temperatures boosted Thursday’s demand for gas-powered electricity.
- U.S. inventories rose by 58 Bcf, with European storage at 93%, signaling strong supply.
Natural Gas Daily Price Analysis – 20/09/2024
Natural Gas prices saw a minor decline on Friday after closing the previous session on a positive note. The current price hovers at $2.345, slightly down by -0.13%, compared to Thursday’s close at $2.348, which was a significant +2.80% rise from its opening at $2.288. This moderate fluctuation in prices reflects the interplay between supply dynamics and shifting weather forecasts.
Price Drivers
The notable increase on Thursday was fueled by expectations of warmer-than-usual temperatures across the U.S. through early October, raising the need for natural gas to power air conditioning units. This weather-driven demand forecast, combined with a round of short-covering, helped push prices higher despite an initially bearish sentiment following the weekly EIA inventory report.
According to the EIA, natural gas inventories rose by 58 Bcf, slightly above market expectations of a 56 Bcf increase. This inventory build, while above forecasts, remains below the five-year average for this time of year, which is typically around +80 Bcf. This supply surplus, alongside European storage levels, sitting at 93% full, signals ample supply in the short term, tempering any strong bullish momentum.
Supply and Demand Insights
Production trends provide mixed signals. Dry gas production in the Lower-48 states is down 1.3% year-over-year, currently at 100 billion cubic feet per day, while gas demand has surged 11.7% year-over-year, largely due to the higher consumption by electricity providers. The rise in U.S. electricity output, particularly with an increase of 0.51% year-over-year, bodes well for natural gas demand in the near future. In contrast, U.S. consumption fell by 0.9% this week across major sectors, reflecting some market softening.
Additionally, the U.S. natural gas market continues to be influenced by international trends, particularly with LNG prices in East Asia and Europe decreasing. East Asia saw a drop to $13.40/MMBtu, and Europe’s Title Transfer Facility prices fell to $11.44/MMBtu. These international market movements could put downward pressure on U.S. gas exports, further affecting prices in the coming weeks.
Key Economic Data and News to Be Released Today
While there’s no high impact economic data that can directly affect the Natural Gas prices today, weather patterns will remain a key factor. Warmer temperatures in the U.S. could support higher demand for natural gas while supply remains abundant with strong storage levels. However, if demand eases or production increases, we could see prices weaken further.
Natural Gas Technical Analysis – 20/09/2024
Price action on Natural Gas today is better described as choppy. Price has massively pushed to the upside yesterday only to be met with huge indecision as both buyers and sellers seem to struggle keeping the commodity on a clear trend.
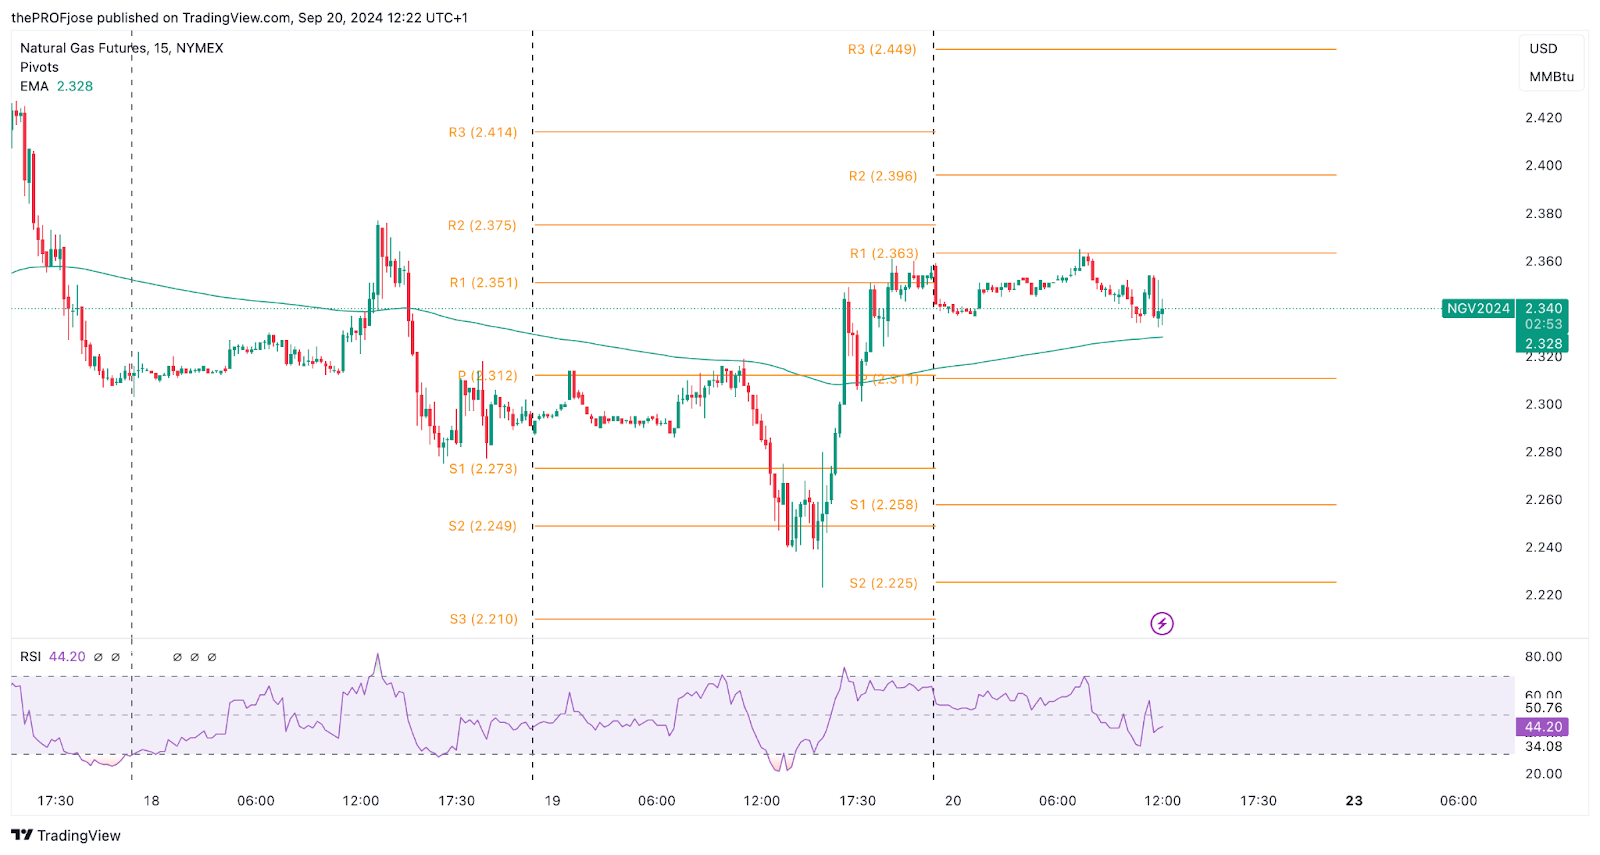
Natural Gas has crossed above the 200 EMA in the 15-minute timeframe, suggesting a bullish trend. However, it has failed to close above the resistance zone around 2.363. In fact, judging by the RSI, we might still have a further downward push before the price eventually starts heading to the upside.
So, what does this mean to us? Simple: it’s not the best trading condition to place a short-term trade. Market is consolidating and traders will be better off waiting for a clear trend before taking any trades.
Natural Gas Fibonacci Key Price Levels 20/09/2024
Short-term traders planning to trade the NG today should keep a close eye on the following key price levels for the day:
| Support | Resistance |
| 2.258 | 2.363 |
| 2.225 | 2.396 |
| 2.173 | 2.449 |
Risk Disclosure: The information provided in this article is not intended to give financial advice, recommend investments, guarantee profits, or shield you from losses. Our content is only for informational purposes and to help you understand the risks and complexity of these markets by providing objective analysis. Before trading, carefully consider your experience, financial goals, and risk tolerance. Trading involves significant potential for financial loss and isn't suitable for everyone.