Short-term colder weather temporarily increased heating demand, but forecasts for milder conditions afterward may cap upside momentum.
Key Points
- Natural Gas rose +1.97% to $3.102/MMBtu, driven by LNG exports and weather shifts.
- Exports hit 14.2 bcfd, reflecting strong global demand.
- Production rose to 102.3 bcfd, with inventories +7.2% above average.
Natural Gas Daily Price Analysis – 5/12/2024
Natural Gas futures rebounded strongly, with prices climbing to $3.102/MMBtu, a +1.97% increase from today’s open of $3.071. This surge follows Wednesday’s close at $3.043 (+0.03%), which marked a modest recovery from a two-week low.
Natural gas deliveries to the seven major U.S. LNG export facilities rose to an average of 14.2 bcfd in early December, up from 13.6 bcfd in November, approaching record highs. This surge underscores strong global demand for U.S. LNG, supporting prices. The growth in LNG feedgas volumes signals robust export activity, potentially offsetting bearish factors like elevated domestic inventories.
Forecasts indicate a transition from colder-than-normal conditions through December 7 to warmer-than-normal weather afterward. While short-term cold spells have temporarily increased heating demand, the shift to milder temperatures could cap upside price momentum.
Dry gas production in the Lower 48 states increased to 102.3 bcfd in December, compared to 101.5 bcfd in November, though it remains below the record high of 105.3 bcfd from December 2023.
Current U.S. natural gas inventories remain +7.2% above the five-year seasonal average, signaling ample supply that could limit price surges.
Natural gas demand from utilities may face headwinds as U.S. electricity output fell -3.94% y/y to 74,881 GWh for the week ending November 30. Warmer winter temperatures could sustain elevated supply levels, further tempering price gains.
Key Economic Data and News to Be Released Today
The weekly EIA Inventory Report will be released later today. Consensus expects a draw of -36 bcf, smaller than the five-year average of -47 bcf. Any deviation from expectations could influence price direction.
Additionally, adjustments to forecasts for mid-December, particularly colder trends, could trigger additional short covering or bullish momentum.
Natural Gas Technical Analysis – 5/12/2024
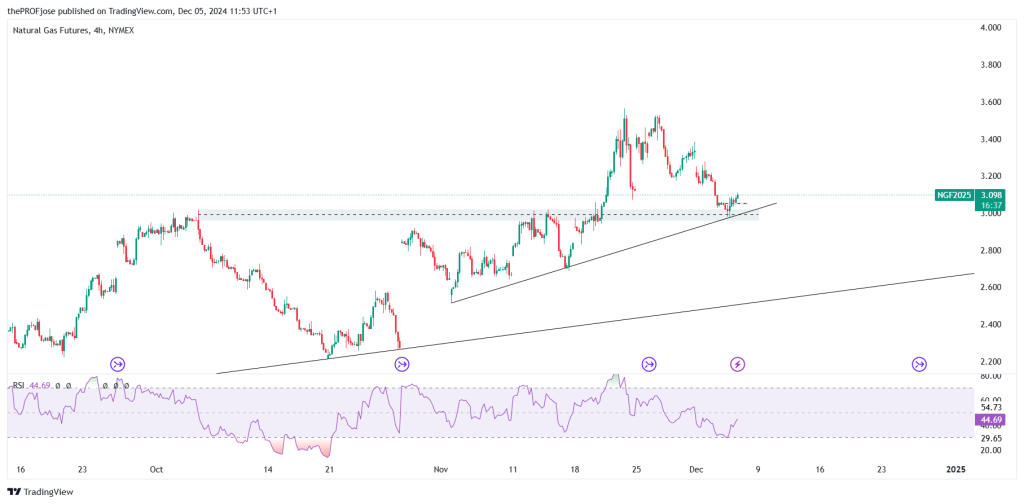
NG looks promising today. The higher timeframe to the lower timeframe presents a high probability of BUY setups. Let’s quickly break it down:

During the 4-hour timeframe, Natural Gas reacts off the lower trendline while hitting the oversold level on the RSI. Having these confluences, we can expect the price to move to the upside in the short term.
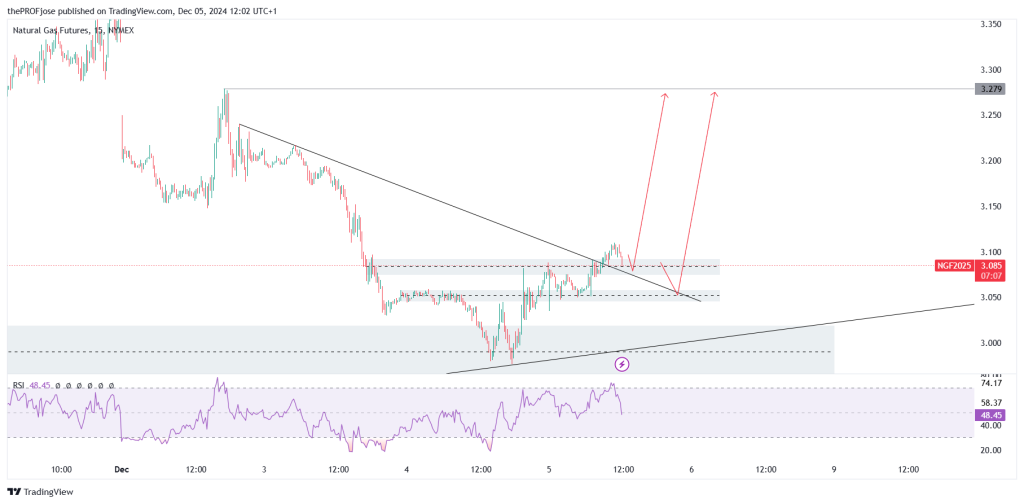
To get an entry, let’s scale down to the 15-minute timeframe. Now that we have a bullish bias from the higher timeframe, we are looking for a BUY setup in the lower timeframe.

After a clear break to the upside, we expect the price to retest any of the key level zones and give us a bullish candlestick pattern before going up.
However, it is worth noting that the RSI on the 15-minute is currently overbought. So, the price may be a little choppy.
Natural Gas Fibonacci Key Price Levels 5/12/2024
Short-term traders planning to invest in NG today should keep a close eye on the following key price levels for the day:
| Support | Resistance |
| 2.994 | 3.078 |
| 2.967 | 3.105 |
| 2.925 | 3.147 |
Risk Disclosure: The information provided in this article is not intended to give financial advice, recommend investments, guarantee profits, or shield you from losses. Our content is only for informational purposes and to help you understand the risks and complexity of these markets by providing objective analysis. Before trading, carefully consider your experience, financial goals, and risk tolerance. Trading involves significant potential for financial loss and isn't suitable for everyone.


