
The EIA reported a 20% decline in wholesale spot natural gas prices at Henry Hub in the first half of the year.
Key Points
- Natural gas prices surged 5.78% in the previous trading day, closing at $2.251 from an opening of $2.104.
- Today, natural gas prices opened at $2.245 and have increased to $2.262, suggesting a stabilizing trend.
- The 200 EMA at $2.195 acts as dynamic support, with the price currently above this level, indicating a short-term bullish trend.
Natural Gas Daily Price Analysis – 23/07/2024
Natural gas prices witnessed a significant uptick in the previous trading day, closing at $2.251 after opening at $2.104, marking a substantial 5.78% increase. This surge can be attributed to several underlying factors, primarily influenced by the broader market conditions and recent economic data. Notably, wholesale spot natural gas prices at the U.S. benchmark Henry Hub experienced a considerable decline in the first half of the year, falling 20% to $2.56 per MMBtu. This decline is reflective of broader market dynamics, including record low prices reported by the U.S. Energy Information Administration.
The drop in prices was driven by a combination of factors, such as record U.S. natural gas inflation, stagnant consumption, and relatively high inventories. Additionally, a mild winter in early 2024 further depressed demand, leading to even lower prices. The EIA highlighted that gas production also saw a downturn due to historically low prices and a severe winter storm in mid-January, contributing to reduced injections into U.S. storage.
As of today, natural gas prices opened at $2.245 and are currently trading at $2.262, reflecting a modest 0.49% increase. The price movement early in the trading day suggests a stabilizing trend, likely influenced by the ongoing balancing act between supply and demand. Despite the price increase, natural gas remains near historic lows, primarily due to high inventories and flat consumption rates. The gradual increase from earlier this year can be seen as a correction from the severely depressed prices witnessed in the first quarter.
Key Economic Data and News to Be Released Today
In the short term, several economic factors could impact natural gas prices. One of the critical pieces of economic data to watch today is the EIA’s weekly natural gas storage report. A higher-than-expected increase in storage levels could exert downward pressure on prices, while a lower-than-expected figure could support further gains. Additionally, any unexpected weather patterns or disruptions in production could also play a significant role in price movements.
Natural Gas Technical Analysis – 23/07/2024
The 200 EMA is positioned around $2.195, which acts as a dynamic support level. The price is currently trading above the 200 EMA, indicating a bullish trend in the short term.
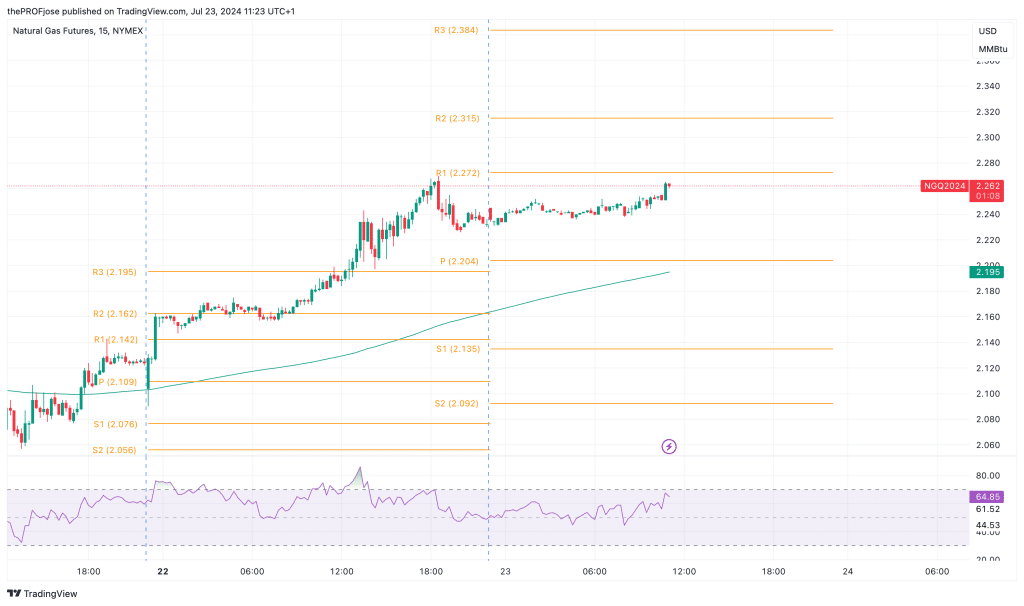
Given the current price is above the 200 EMA and the RSI is approaching overbought levels but not yet overbought, there is potential for further upside. However, caution is warranted as the price nears resistance levels.
Natural Gas Fibonacci Key Price Levels 23/07/2024
Short-term traders planning to invest in NG today should keep a close eye on the following key price levels for the day:
| Support | Resistance |
| 2.135 | 2.272 |
| 2.092 | 2.315 |
| 2.024 | 2.384 |
Risk Disclosure: The information provided in this article is not intended to give financial advice, recommend investments, guarantee profits, or shield you from losses. Our content is only for informational purposes and to help you understand the risks and complexity of these markets by providing objective analysis. Before trading, carefully consider your experience, financial goals, and risk tolerance. Trading involves significant potential for financial loss and isn't suitable for everyone.