U.S. natural gas futures have continued their decline, dropping 3.91% on Friday and 1.23% on Monday due to mixed supply-demand dynamics.
Key Points
- Weaker demand is pressuring prices.
- Reduced production levels and low storage injections may leave the market vulnerable this winter.
- Weather and industrial factors provide mixed signals for natural gas prices.
Natural Gas Daily Price Analysis – 07/10/2024
U.S. natural gas futures faced another decline on Monday, following a 3.91% drop on Friday that ended a five-week winning streak. The current price of $2.819 mmBtu marks a 1.23% decrease from today’s opening price of $2.827. This continued downward trend highlights the market’s struggle with a mixed supply-demand dynamic heading into the fall.
Weak Demand and Storage Builds Weigh on Market
On Friday, natural gas futures settled at $2.854, down from the weekly high of $3.019, amid a weaker demand outlook. Despite the latest report from the U.S. Energy Information Administration showing that utilities added only 55 bcf of gas to storage last week — below analyst forecasts of 57 bcf and significantly lower than the five-year average increase of 98 bcf — it wasn’t enough to sustain upward momentum. Analysts pointed to weaker late-season summer demand and an expected shift to shoulder season dynamics as reasons for the bearish sentiment.
The market appears to be experiencing the final surge of summer demand before transitioning into a shoulder season, which is contributing to the recent pullback. Additionally, supplies going into winter are lower than previously expected, which provides some optimism for an industry that has faced extended periods of low prices.
Production Reductions and LNG Prospects
While the natural gas market faces bearish short-term fundamentals, production levels are supportive of prices. Storage injections during July, August, and likely September have been at record lows due to reduced drilling activity triggered by plummeting prices earlier this year. Federal data indicated that producers significantly cut back on their output after the average spot price at the U.S. Henry Hub hit a 32-year low in March. This move has translated into notably lower storage levels, potentially leaving the market vulnerable as winter approaches.
Production in the Lower 48 states has averaged 101.0 bcfd in early October, down from 101.8 bcfd in September and far below the December 2023 record of 105.5 bcfd, according to data from financial firm LSEG. LNG exports are expected to increase in the coming weeks, further adding to the overall demand picture.
Weather and Industrial Factors Provide Mixed Signals
Weather conditions are also playing a role in natural gas pricing. LSEG estimated 142 total degree days (TDDs) over the next two weeks, slightly up from the 141 estimated last week. This indicates a slightly increased demand for heating and cooling, providing limited support to prices. Average gas demand in the Lower 48, including exports, is forecasted to hold steady at around 95.6 bcfd this week and 95.4 bcfd next week.
Industrial factors have also impacted market sentiment. The delay in a longshoreman strike on the U.S. East Coast and Gulf Coast provided a bullish relief to natural gas prices, with concerns alleviated that extended factory shutdowns could dampen natural gas demand for petrochemicals and plastics production. Ports have started reopening, but the backlog of cargo will take time to clear, adding a layer of uncertainty to the supply chain.
Key Economic Data and News to Be Focus On
While there are no key economic data releases today, the market’s focus on end-of-season storage surpluses may overshadow bearish fundamentals, particularly with ongoing production cuts and rising LNG export expectations.
Natural Gas Technical Analysis – 07/10/2024
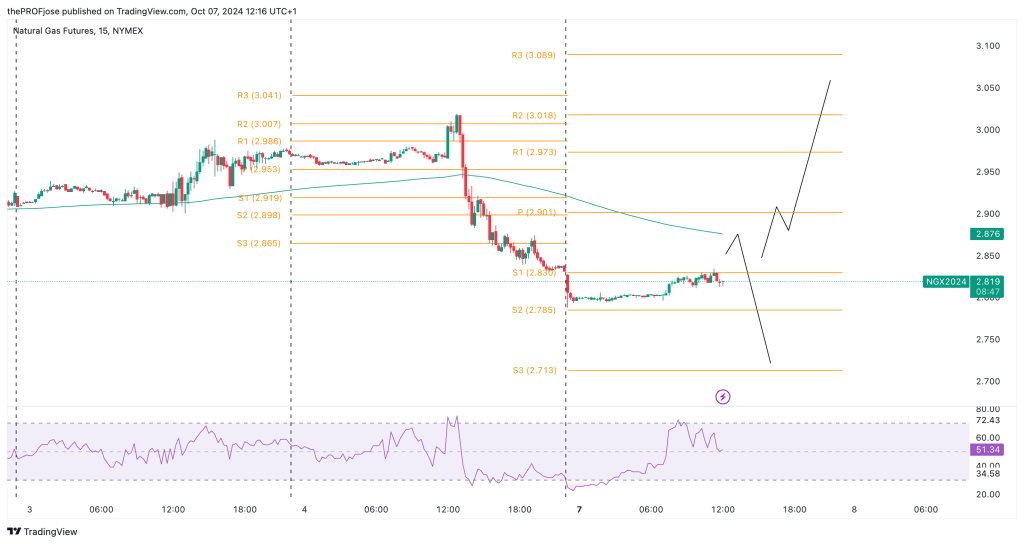
After the huge drop experienced on NG last week, today’s price movement so far is merely a consolidation. Although the price is currently under the 200 EMA, taking a short trade isn’t as clear as it should.

From the chart above, we can see two scenarios we can look forward to in the short term. For traders looking to short the natural gas market, a good rejection of the 200 EMA with a bearish candlestick pattern may be a good entry setup. On the other hand, a break and close above the pivot point can significantly count towards a bullish reversal.
Natural Gas Fibonacci Key Price Levels 07/10/2024
Short-term traders planning to invest in NG today should keep a close eye on the following key price levels for the day:
| Support | Resistance |
| 2.830 | 2.973 |
| 2.785 | 3.018 |
| 2.713 | 3.089 |
Risk Disclosure: The information provided in this article is not intended to give financial advice, recommend investments, guarantee profits, or shield you from losses. Our content is only for informational purposes and to help you understand the risks and complexity of these markets by providing objective analysis. Before trading, carefully consider your experience, financial goals, and risk tolerance. Trading involves significant potential for financial loss and isn't suitable for everyone.


