
Despite ongoing heatwaves, the downward pressure on natural gas prices persists due to an ample supply, which remains 12% above the five-year average.
Key Points
- Natural gas futures fell 3.26% on Monday, driven by forecasts of cooler September weather reducing demand.
- The bearish trend continued Tuesday, with prices down 1.89% to $1.919 mmBtu, influenced by high storage levels.
- Cooler temperatures and seasonal demand changes may maintain the bearish trend unless significant disruptions occur.
Natural Gas Daily Price Analysis – 27/08/2024
U.S. natural gas fell 3.26% on Monday for a fifth consecutive session to $1.956 mmBtu. The drop in prices took the commodity to a three-week low, reflecting cooler forecasts for the first week of September that are expected to curtail demand from utilities seeking gas-fired electricity for cooling. In addition, although the heatwave is continuing so far this month, downward pressure on prices comes from an ample natural gas supply, which remains over 12% above the five-year average.
Natural gas started the day in negative territory once again on Tuesday, as prices fell 1.89% to $1.919 per mmBtu ahead of the latest trading session. This decline further extends the bearish momentum experienced last week. Market participants are focused on how the cooler temperatures forecasted for next week will impact short-term demand. The continued high levels of natural gas in storage, coupled with steady production levels, suggest that prices may remain under pressure unless there is a significant shift in demand. Additionally, the situation in the Middle East could be another trigger for upward movement in natural gas prices.
Moreover, if temperatures moderate and natural gas consumption decreases with the seasonal change, the market may continue to experience bearishness unless either a significant weather event occurs unexpectedly or there are disruptions in supply.
Key Economic Data and News to Be Released Today
Several key factors could influence natural gas prices in the short-term. For instance, the U.S. Consumer Confidence Index is due for publishing later today, potentially offering clues about wider economic conditions that could impact energy use as a whole. Also on investors’ radar this week will be Thursday’s EIA Weekly Natural Gas Storage Report. Because any anomalies in storage change can set off the price, making it very volatile.
Natural Gas Technical Analysis – 27/08/2024
The overall trend is bearish, as price is consistently moving below the 200 EMA while forming a sequence of lower highs and lower lows on the chart. The market has shown an inability to sustain any upward momentum, leading to the conclusion that the bearish trend is still intact.
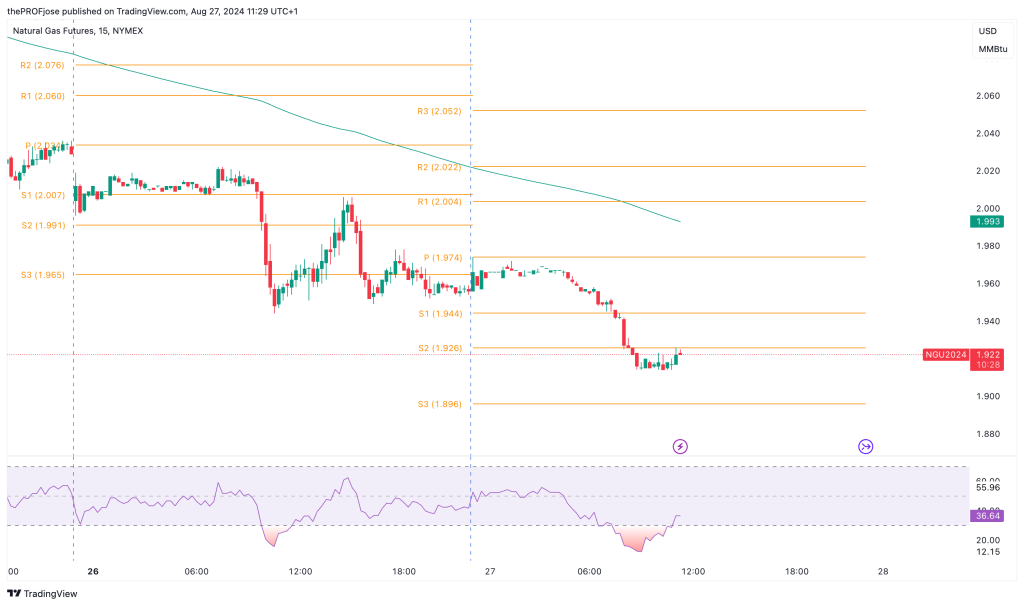
In the short term, given the RSI’s oversold condition, there could be a retracement or a brief upward correction. Price action may target the immediate pivot level at 1.974 or the 200 EMA, depending on the strength of the bounce. However, the overall downtrend suggests that any such upward movement may be temporary. If the price fails to break above the 200 EMA or the pivot point, it is likely to resume its downward trajectory, with potential targets around the S3 level.
Natural Gas Fibonacci Key Price Levels 27/08/2024
Short-term traders planning to invest in NG today should keep a close eye on the following key price levels for the day:
| Support | Resistance |
| 1.944 | 2.004 |
| 1.926 | 2.022 |
| 1.896 | 2.052 |
Risk Disclosure: The information provided in this article is not intended to give financial advice, recommend investments, guarantee profits, or shield you from losses. Our content is only for informational purposes and to help you understand the risks and complexity of these markets by providing objective analysis. Before trading, carefully consider your experience, financial goals, and risk tolerance. Trading involves significant potential for financial loss and isn't suitable for everyone.