Natural gas prices continue to decline, primarily driven by warmer-than-expected U.S. weather forecasts that reduce heating demand.
Key Points
- Eased Middle East tensions lowered European gas prices, alleviating supply concerns.
- U.S. demand remains stable, with strong LNG exports and electricity output.
- Rising inventories above seasonal averages suggest ample supply, pressuring prices.
Natural Gas Daily Price Analysis – 29/10/2024
Natural gas prices have encountered a notable downward trend, shedding 7.41% on Monday and continuing with a 1.19% decrease in early Tuesday trading. This decline stems primarily from weather forecasts predicting warmer-than-normal temperatures across the U.S., which has dampened heating demand and weakened natural gas demand expectations. Specifically, Maxar forecasts mixed temperatures from November 2-6, with slightly cooler temperatures in the West and above-normal temperatures in the East, followed by consistently above-average temperatures from November 7-19. Such conditions typically reduce heating needs, directly impacting natural gas demand.
Adding to the bearish sentiment, European natural gas prices dropped by over 2% on Monday, largely in response to diminished geopolitical tensions in the Middle East, as Israel’s recent retaliatory attack on Iran remained limited in scope. This has alleviated immediate concerns about supply disruptions in the region, contributing to downward pressure on prices.
Supply and Demand Insights
U.S. lower-48 state dry gas production remained stable on Monday, averaging 102.9 billion cubic feet per day (bcf/day), a slight 0.3% decrease year-over-year. Demand, however, has seen an uptick, with lower-48 state gas demand reaching 72.6 bcf/day, marking a 6.2% year-over-year increase. Liquefied natural gas export activity also remains robust, with net flows to U.S. LNG export terminals at 13.2 bcf/day, up 5.7% week-over-week, indicating sustained export demand.
U.S. electricity output, which impacts natural gas demand, has also shown growth. According to the Edison Electric Institute, total U.S. electricity output for the lower-48 states rose by 2.59% year-over-year for the week ending October 19, totaling 70,893 GWh. Over the last 52 weeks, output increased by 1.68% year-over-year, underscoring a steady demand for natural gas from utility providers.
Inventory and Supply Conditions
The latest report from the Energy Information Administration highlighted a bearish trend in natural gas inventories, which rose by 80 bcf for the week ending October 18, surpassing expectations of a 68 bcf increase and the five-year seasonal average build of 76 bcf. This increase has brought inventories to 2.3% above last year’s levels and 4.6% above the five-year average, underscoring ample supply and exerting further pressure on prices. European storage levels also reflect high inventory levels, with storage at 95% full as of October 22, above the five-year seasonal average of 92%.
Drilling activity has picked up modestly, with Baker Hughes reporting a rise of two active natural gas rigs in the U.S. to 101 rigs. Although this marks an increase from the recent low of 94 rigs in early September, it remains far below the five-year high of 166 rigs in September 2022. Despite recent upticks, the sustained lower rig count from earlier highs highlights caution in expanding drilling amid fluctuating prices and inventory dynamics.
Key Economic Data and News to Be Released Today
As of today, there is no significant economic data specifically expected to impact natural gas prices. However, any unexpected weather updates or geopolitical developments, particularly related to supply disruptions in natural gas-producing regions, could lead to short-term volatility.
Natural Gas Technical Analysis – 29/10/2024
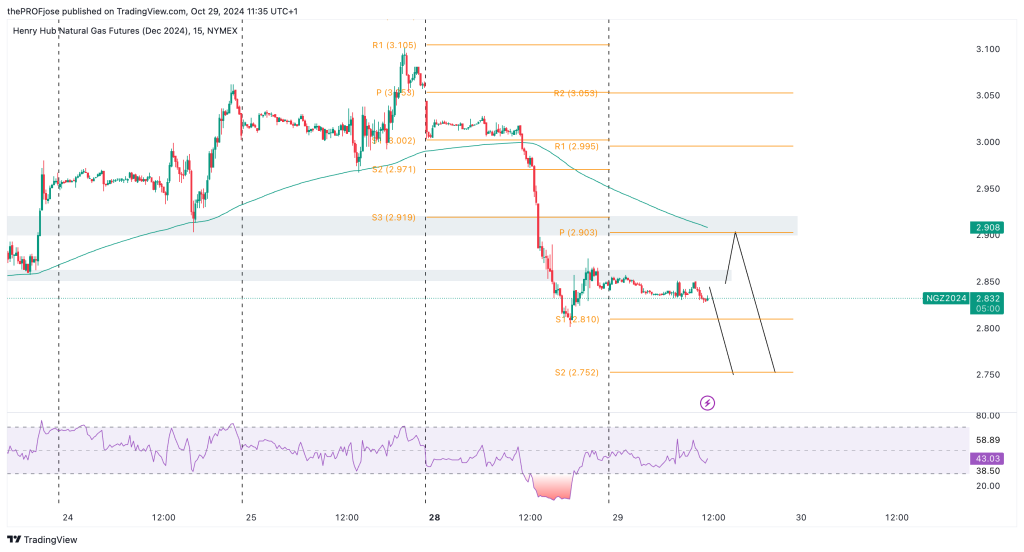
Technical outlook on Natural Gas is still very bearish. First off, price is currently trending below the intraday 200 EMA, signifying that the sellers are quite active in the market at the moment.

Currently, the price is reacting to a key resistance level, which may continue to drive the price down. Should this key level fail to take the price down, we might have a brief retracement to a higher resistance level before the price continues its bearish movement. The RSI is also adding a bearish confluence to the bias as it’s not at the oversold level yet. This signifies that there’s still enough room for the market to move further down.
Natural Gas Fibonacci Key Price Levels 29/10/2024
Short-term traders planning to invest in NG today should keep a close eye on the following key price levels for the day:
| Support | Resistance |
| 2.810 | 2.995 |
| 2.752 | 3.053 |
| 2.660 | 3.146 |
Risk Disclosure: The information provided in this article is not intended to give financial advice, recommend investments, guarantee profits, or shield you from losses. Our content is only for informational purposes and to help you understand the risks and complexity of these markets by providing objective analysis. Before trading, carefully consider your experience, financial goals, and risk tolerance. Trading involves significant potential for financial loss and isn't suitable for everyone.


