European gas prices remain subdued due to high storage levels and less demand despite increased cooling needs in Europe and Asia.
Key Points
- Last Friday, Natural Gas prices increased by 2.69% due to short-covering and a weaker dollar.
- Today, prices fell by 2.53%, affected by Hurricane Beryl’s impact on Texas LNG facilities.
- Key economic releases today include the NY Empire State Manufacturing Index and the BoC Business Outlook Survey.
Natural Gas Daily Price Analysis – 15/07/2024
Natural Gas prices experienced a significant uptick last Friday, closing at $2.329, up from the opening price of $2.267, marking a 2.69% increase. This rise was largely driven by short-covering in the futures market after the dollar index dropped to a five-week low. The market also responded to mixed weather forecasts, with cooler weather expected in the central U.S. while intense heat persisted in the Northwest, boosting demand for air conditioning and, consequently, natural gas consumption.
As of today, Natural Gas prices have opened at $2.273 and are currently trading lower at $2.270, reflecting a 2.53% decrease from the previous close. The decline in prices can be attributed to the ongoing impact of Hurricane Beryl, which, despite causing less damage than initially expected, has left many liquefied natural gas export facilities in Texas without power, curtailing U.S. supply. Additionally, European gas prices have been under pressure due to ample storage inventories and lower-than-anticipated demand.
The recent surge in cooling demand across Europe and Asia due to extreme heat has not been enough to offset the bearish sentiment in the natural gas market. European gas storage facilities are nearly 80% full, significantly above the five-year average, which has kept prices subdued despite the peak summer demand. Moreover, the outlook for the week includes potential price support from ongoing hot temperatures in the U.S., which could increase natural gas consumption for cooling purposes.
Key Economic Data and News to Be Released Today
Looking ahead, several high-impact economic data releases could influence natural gas prices. Notably, the U.S. NY Empire State Manufacturing Index, scheduled for release at 12:30 PM GMT+0, could provide insights into industrial activity and energy demand. Also, the BoC Business Outlook Survey at 14:30 PM GMT+0 might offer clues on economic conditions in Canada, a major natural gas exporter. These data points, along with continued monitoring of weather patterns and LNG export activity, will be crucial in determining the short-term direction of natural gas prices.
Additionally, weather forecasts indicating extreme heat in Europe and Asia are expected to drive up cooling demand, which could influence spot market purchases and, subsequently, price movements in the short term.
Natural Gas Technical Analysis – 15/07/2024
In the 15-minute timeframe, the price has been trading below the 200 EMA, indicating a bearish sentiment. However, recent price action shows an attempt to break above this moving average, which could signal a potential shift in trend if sustained.
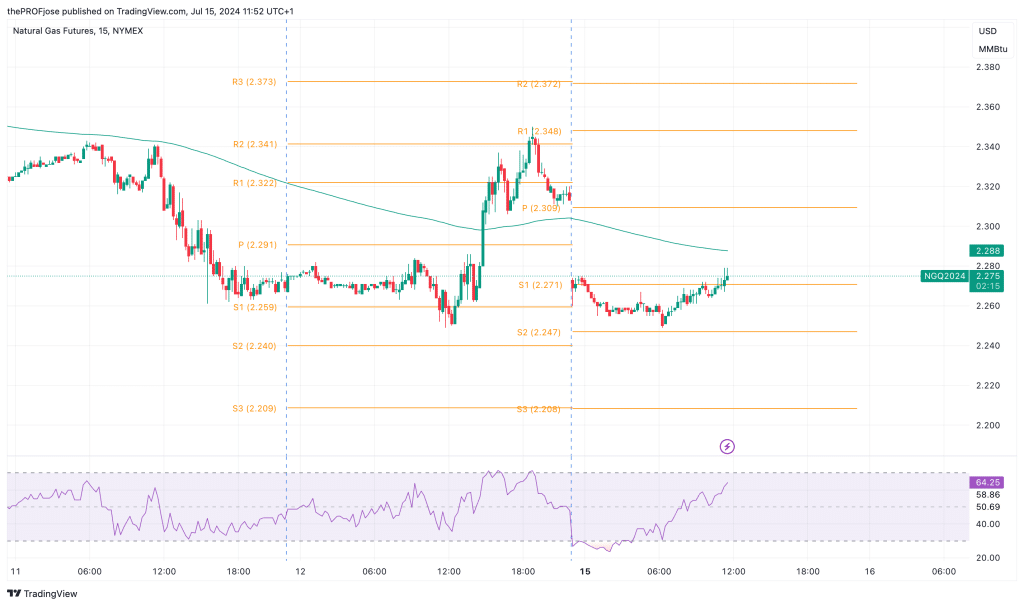
The RSI is currently at 64.25, suggesting that the asset is approaching overbought territory but has not yet reached an extreme level. So, given the current position near the 200 EMA and the rising RSI, the market shows signs of potential bullishness in the short term.
If the price can break and sustain above the 200 EMA, it may target the resistance levels at 2.322 and 2.341. Conversely, failure to break above the 200 EMA could see the price testing support levels at 2.259 and below.
Natural Gas Fibonacci Key Price Levels 15/07/2024
Short-term traders planning to invest in NG today should keep a close eye on the following key price levels for the day:
| Support | Resistance |
| 2.271 | 2.348 |
| 2.247 | 2.372 |
| 2.208 | 2.410 |
Risk Disclosure: The information provided in this article is not intended to give financial advice, recommend investments, guarantee profits, or shield you from losses. Our content is only for informational purposes and to help you understand the risks and complexity of these markets by providing objective analysis. Before trading, carefully consider your experience, financial goals, and risk tolerance. Trading involves significant potential for financial loss and isn't suitable for everyone.