Expectations of lower U.S. interest rates, fueled by dovish comments from Fed officials, continue to support gold prices.
Key Points
- Gold closed at $2,459.9 yesterday, falling due to profit-taking from recent highs.
- Gold is bullish today, trading at $2,465.1 amid rate-cut speculation.
- U.S. jobless claims and home sales data today could impact gold prices.
Gold Daily Price Analysis – 18/07/2024
Gold decreased slightly on the last day of trading to close at $2,459.9 after opening at $2473.2. This fall came, although there was still much speculation that the Federal Reserve might start cutting rates, which would normally underpin gold prices by putting pressure on the dollar and Treasury yields. The minor dip in gold’s price could be attributed to market adjustments following its recent highs, as investors take profits from the surge that saw gold prices hitting an all-time high of $2,483.60.
Economic data and dovish comments from Fed officials, including Fed Governor Christopher Waller and New York Fed President John Williams, have fueled expectations of lower interest rates. This sentiment was further supported by Richmond Fed President Thomas Barkin’s positive outlook on declining inflation. Such factors generally support gold, as lower rates reduce the opportunity cost of holding non-yielding bullion.
Gold is on a bullish trend as of today, opening at $2,462.5 and currently trading at $2,465.1, up from 0.21%. The upward move in the price also fits with general market sentiment playing off talk of impending U.S. rate cuts by speculators.
For instance, gold remains a favored asset among analysts as long the bulls can keep both Dollar and Treasury yields from offering something too palatable. More dovish comments with a weakening U.S. labor market could keep gold prices supported throughout the day, however.
Key Economic Data and News to Be Released Today
Looking ahead, several high-impact economic data releases could influence gold prices. The market will closely watch the U.S. initial jobless claims and existing home sales data. Weakness in these indicators could further bolster expectations of a rate cut, providing additional support for gold.
Meanwhile, heightened geopolitical risk especially between the USA and China could underpin safe-haven derivatives including Gold. On top of it, investors may look to hedge against potential trade war repercussions which could add one more layer of support for the previous metal.
Gold Technical Analysis – 18/07/2024
The overall trend for Gold remains bullish, supported by the price trading above the 200 EMA. However, the precious metal is currently consolidating just below the pivot level, making the next direction a little uncertain.
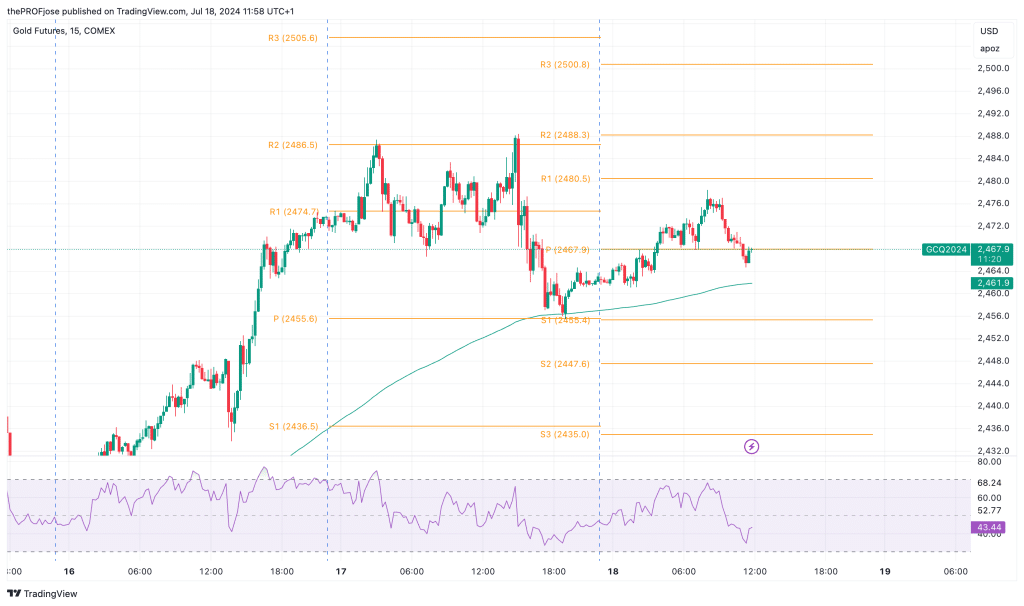
If the price manages to stay above the 200 EMA and pivot point, a rebound towards the R1 and possibly retesting the R2 is likely. A break above R2 could see prices aiming for R3, driven by strong bullish momentum and favorable economic data.
Conversely, if the price breaks below the 200 EMA and pivot point, a deeper pullback towards S1 and S2 is possible. The RSI indicates there is room for further downside before reaching oversold conditions, suggesting that a correction could extend if key support levels are breached.
Gold Fibonacci Key Price Levels 18/07/2024
Short-term traders planning to trade gold today should keep a close eye on the following key price levels for the day:
| Support | Resistance |
| 2455.4 | 2480.5 |
| 2447.6 | 2488.3 |
| 2435.0 | 2500.8 |
Risk Disclosure: The information provided in this article is not intended to give financial advice, recommend investments, guarantee profits, or shield you from losses. Our content is only for informational purposes and to help you understand the risks and complexity of these markets by providing objective analysis. Before trading, carefully consider your experience, financial goals, and risk tolerance. Trading involves significant potential for financial loss and isn't suitable for everyone.