Gold prices remain rangebound after a record high in October, with the dollar’s rise and Treasury yield increases contributing to its current behavior.
Key Points
- Gold futures rose 0.3% to $2,665.60, with reduced volatility and a narrow $26 price range.
- The Fed is likely to hold rates steady, driven by a 2.3% PCE inflation rise and economic uncertainties.
- The JOLTS and Fed’s speeches may affect gold prices today.
Gold Daily Price Analysis – 03/12/2024
Gold prices have exhibited modest fluctuations recently, with futures rising 0.3% to $2,665.60 per troy ounce. The five-day average daily price range has narrowed to just $26, indicating reduced volatility.
This trend suggests that the market has found a fair value, with investors showing little conviction to drive prices significantly higher or lower, regardless of factors like the U.S. dollar’s performance, interest rates, or geopolitical tensions. However, this calm may not persist, as the typical seasonal December rally could prompt an upward push by year-end.
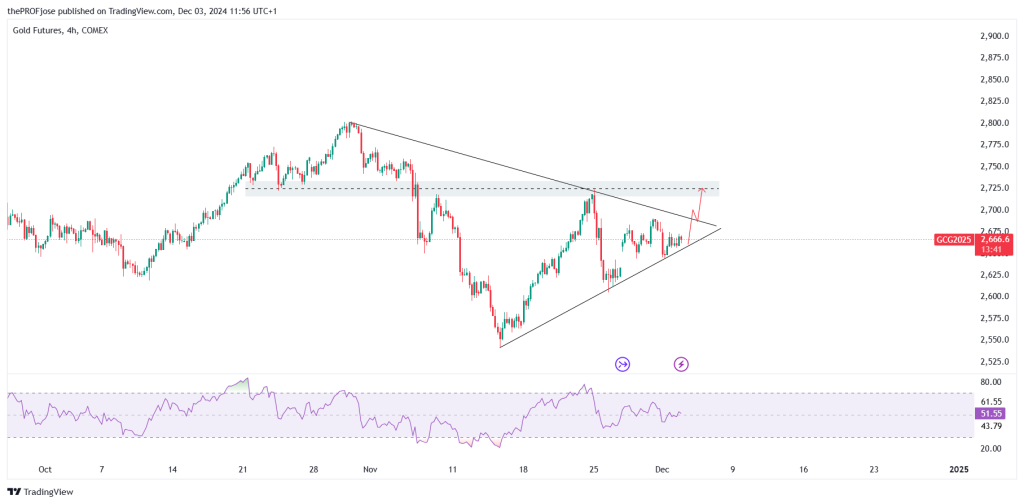
On Monday, gold traded lower in the afternoon as the dollar strengthened amid rising expectations that the Federal Reserve may maintain current interest rates in its upcoming policy meeting. The precious metal has remained rangebound since correcting from a record high of $2,800.80 on October 30, influenced by the dollar’s surge post-U.S. election and persistent inflation above the Federal Reserve’s 2% target.
The U.S. October personal consumption expenditures index, the Fed’s preferred inflation measure, rose at a 2.3% annualized rate, up from 2.1% in September. This increase, coupled with potential economic uncertainties from the incoming administration, has led some analysts to anticipate that the Fed will hold rates steady at the December 18 FOMC meeting.
The CME FedWatch Tool indicates a 62% probability of a 25 basis point rate cut, down from 83% a month earlier, with expectations for unchanged rates rising to 38% from 17%.
The dollar’s rise was evident, with the ICE dollar index up 0.76 points to 106.50. Treasury yields also increased, with the U.S. two-year note yielding 4.202%, up 4.3 basis points, and the 10-year note yielding 4.193%, up 1.8 points.
Key Economic Data and News to Be Released Today
Today, the U.S. Bureau of Labor Statistics will release the Job Openings and Labor Turnover Survey (JOLTS) for October, providing insights into labor market dynamics. Additionally, Federal Reserve Governor Adriana D. Kugler is scheduled to speak at 12:35 p.m. Eastern Time at a Detroit Economic Club event, discussing labor market and monetary policy.
Later, at 3:15 p.m. Eastern Time, Federal Reserve Bank of Chicago President Austan Goolsbee will deliver a keynote conversation about the Midwest economy at Crain’s Power Lunch in Chicago.
While the JOLTS report can influence investor sentiment and potentially impact gold prices, the speeches by Fed officials may also provide insights into the central bank’s economic outlook and monetary policy stance, which could affect Gold prices.
Gold Technical Analysis – 03/12/2024
Trading Gold in a ranging market requires some skills and a lot of patience. But there seems to be a potential setup waiting for us today. So, let’s break it down.

On the 4-hour timeframe, price is trading within a symmetrical triangle. However, price just reacted to the lower trendline, giving us a hint that we may expect Gold prices to rise in the short-term.
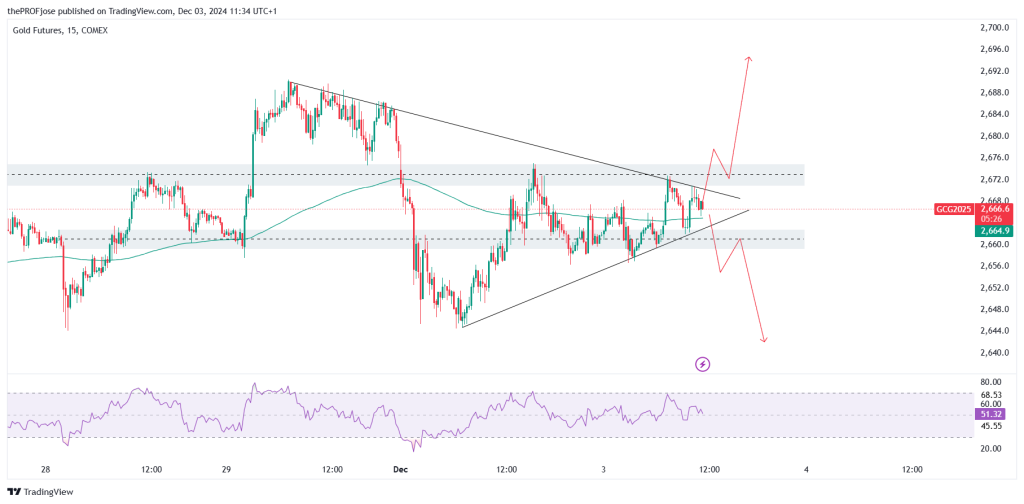
On the 15-minute chart, we can see the fractal nature of price playing out as well: price is also forming a symmetrical triangle on the lower timeframe.

As seen on the chart above, there’s a potential for both long and short trades, provided the criteria are met. If the price breaks out to the upside, we will have a trend-following BUY setup. On the other hand, should the price breakout to the downside, we may see a short-term counter-trend SELL setup play out. In either case, wait for a confirmation before entering a trade.
Gold Fibonacci Key Price Levels 03/12/2024
Short-term traders planning to trade gold today should keep a close eye on the following key price levels for the day:
| Support | Resistance |
| 2647.5 | 2673.5 |
| 2639.5 | 2681.5 |
| 2626.5 | 2694.5 |
Risk Disclosure: The information provided in this article is not intended to give financial advice, recommend investments, guarantee profits, or shield you from losses. Our content is only for informational purposes and to help you understand the risks and complexity of these markets by providing objective analysis. Before trading, carefully consider your experience, financial goals, and risk tolerance. Trading involves significant potential for financial loss and isn't suitable for everyone.


