


Amidst higher-than-expected US inflation data, gold prices experienced notable downward movements before the US market opened, falling 1.39%.
Key Points
- Gold price sees a significant decline, trading around $1,992.14 per ounce following better-than-expected CPI figures.
- US inflation data and the rise in CPI are likely to impact the gold market in the following days.
- The next support level for Gold lies around $1983 per ounce.
Gold Daily Price Analysis – 13/02/2024
Yesterday, gold experienced a modest decline, closing at $2,019.02 per ounce after reaching a high of $2,028.09 and a low of $2,011.91. This represented a decrease of $4.74 or -0.22% from the opening price, continuing the slight downward trend observed over the weekend from February 10-11, 2024.
Today, February 13, the gold market has further retreated, with the bid price at $1992.14 per ounce, marking a drop of $27.60 or -1.37%. The fall in prices comes on the back of warmer U.S. inflation data, suggesting an economic environment where investors may be pivoting away from traditional safe havens like gold. This sell-off coincided with the U.S. CPI rising by 0.3% for January, with an annual inflation rate increase of 3.1%, above analysts’ expectations of 2.9%.
The data is likely to postpone the Fed’s rate cut in March, pushing the US dollar higher, with the US Dollar Index (DXY) rising by 0.57%. US indices fall sharply following the data, with the S&P 500 dropping -1.27%.
Key Economic Data and News to Be Released Today
The gold market is reacting sensitively to the warmer U.S. inflation data and the general economic outlook. Investors keenly observe these indicators as they provide vital insights into the US economy’s health and potential future monetary policy actions.
Gold Technical Analysis – 13/02/2024
From a technical perspective, gold prices are at a crucial juncture. The recent decline brings it closer to key support levels, which traders should monitor closely. While the recent news has blown prices below major pivot points, short-term traders have to rely on psychological key levels and technical indicators to predict what price may do next.
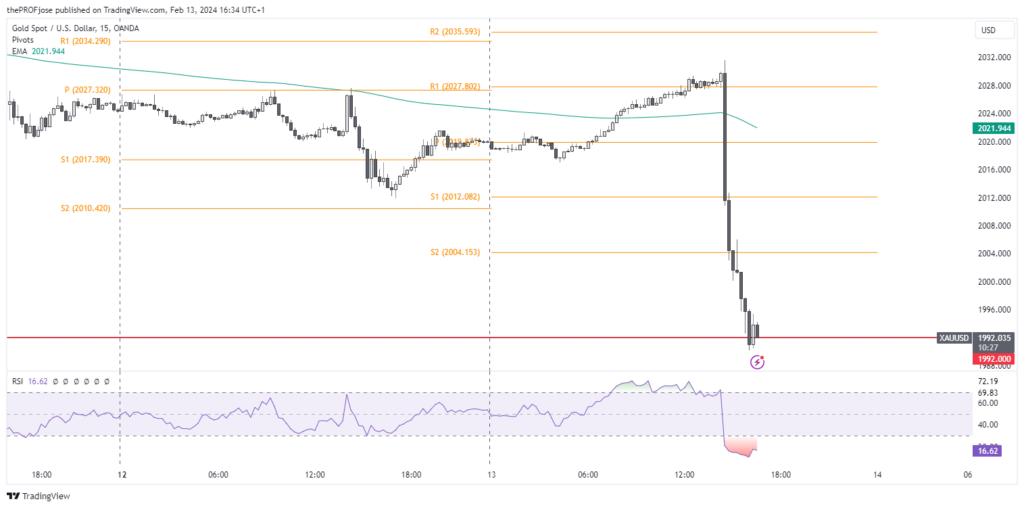
The above chart shows that the price is reacting to the 1992.00 psychological level, with the RSI indicating that the price is oversold. Yet, the CPI data can affect the market sentiment in the following days, as the US dollar is likely to continue strengthening.
Related Articles
Risk Disclosure: The information provided in this article is not intended to give financial advice, recommend investments, guarantee profits, or shield you from losses. Our content is only for informational purposes and to help you understand the risks and complexity of these markets by providing objective analysis. Before trading, carefully consider your experience, financial goals, and risk tolerance. Trading involves significant potential for financial loss and isn't suitable for everyone.


