Setting Up Technical Indicators for Stocks Analysis in MetaTrader 4 (MT4)
Now that you know the purpose of each technical indicator and how to use them, it’s time to learn how to add these indicators to your trading platform.
Luckily, most trading platforms have a very similar charting system, which means that if you know how to add indicators on one electronic trading platform, then you’ll be able to do the same on almost every other trading platform.
So, in this lesson, we will show you how to add the most useful technical analysis indicators to one of the most popular trading platforms in the world among retail investor accounts – the MetaTrader4 and 5.
Even though MT4 is best known for trading foreign exchange currency pairs and getting access to the forex market, it is also an excellent platform for those who want to get stock exchange trading via CFDs.Regardless, if you know how to set up technical indicators in MT4 for stocks, you can literally do it on any other trading platform. Well, let’s start!
Setting Up Trend Lines on Stock Charts
From the top bar menu, Select “Draw Trend Line” instead of “Draw Horizontal Line”

Once you’ve selected this tool, you can start drawing your trendline near the desired point. Don’t worry if it’s not absolutely precise, as you can always change the values later on.
Next, right-click anywhere on the trendline and choose “Trendline Properties”.
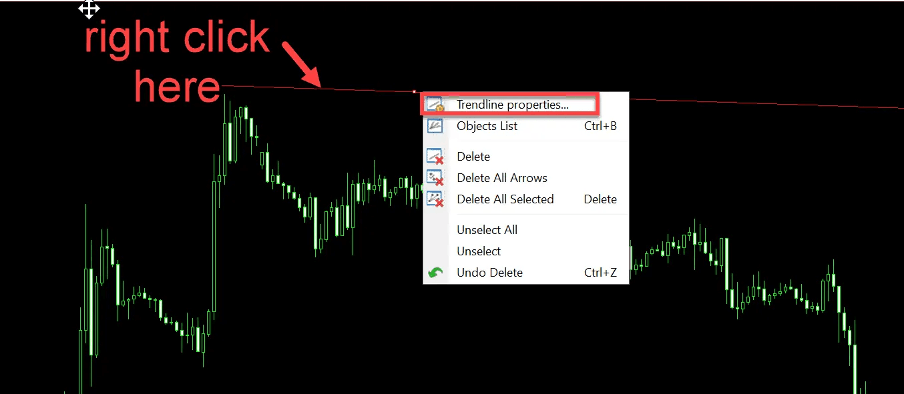
Lastly, change the values of the “parameters” tab. You will be asked to enter the values for your trend lines. Remember, both of these values are the same. Once you have entered the values, all you need to do is deselect “ray,” and you are ready to start trading with trend lines.
As we explained in the previous lessons, trend lines are an excellent way to identify price trends in the market and find entry and exit levels. Follow the steps below to draw your trend lines in your MetaTrader 4 (MT4) platform.
Setting Up Trend Channels on Stock Charts
Like trend lines, trend channels are an effective tool for analyzing the stock market and finding trading opportunities when trading CFDs. The process of adding trend channels to MetaTrader 4 is pretty simple, and all you have to do is to follow the steps below:
- From the top navigation bar, click Insert, then select channels
- Then, from the drop-down menu, choose the standard deviation
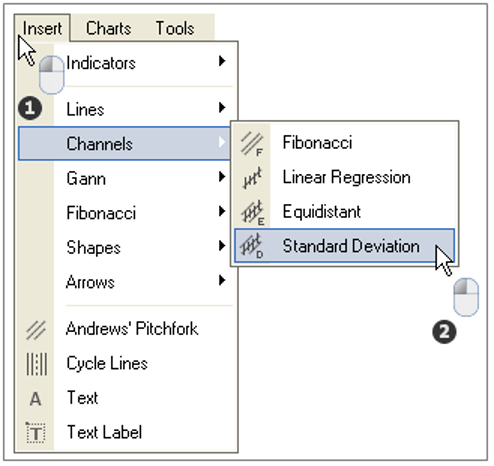
- Next, select where you want the channel to start on your price chart
- Move your mouse to the end of the channel and release the button
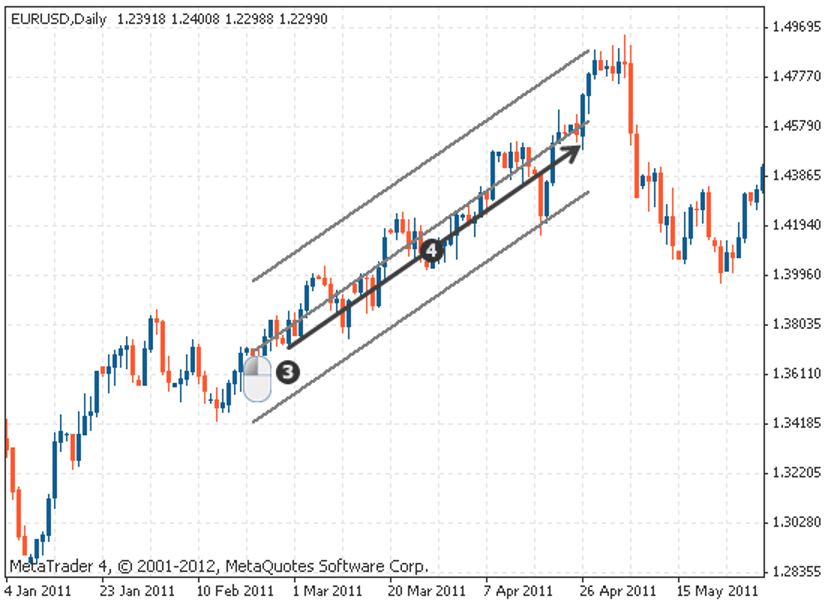
- And that’s it! Your trend channel is now ready.
Setting Up Fibonacci Retracement Levels on Stock Charts
Fibonacci retracement levels are the most common and popular technical analysis tool to identify support and resistance levels and find successful trades. Ironically, many beginner traders think that using Fibonacci retracements is somewhat complicated; however, once you learn how to add them to your trading chart, you will see that it’s pretty straightforward.
Here’s how to do it:
- From the top navigation bar, click Insert and move your mouse over Fibonacci.
- Select the Retracement option
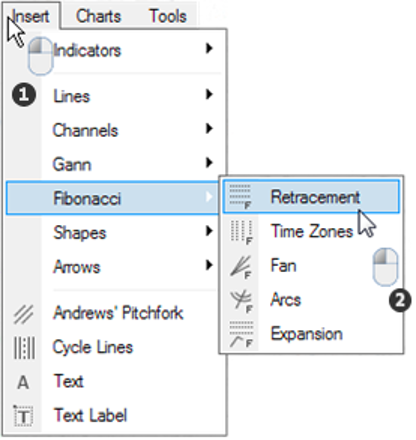
- Click and hold on your chart where you want the Fibonacci retracement levels to start and where you want to end. To do that, you need to identify the highest and lowest levels of the stock’s price over a specific period.
- Once you’re happy with where it’s placed, release the mouse
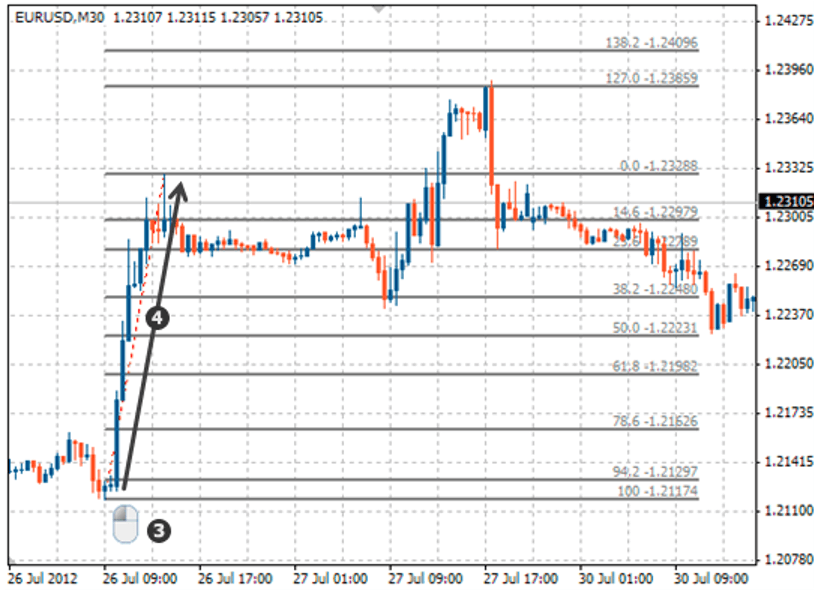
- And that’s your Fibonacci retracement levels ready! Now, you can use each retracement level to determine whether it is a good level to buy or sell the asset.
Setting Up Moving Averages on Stock Charts
Finally, moving averages. This is one of the most commonly used and effective technical indicators, especially for those who are involved in automated trading and algorithmic trading.
To add moving averages to your MT4 trading platform, here’s what you need to do:
- From the top bar menu, click Insert and move your mouse over Indicators choose Trend
- From the drop down menu, click Moving Average
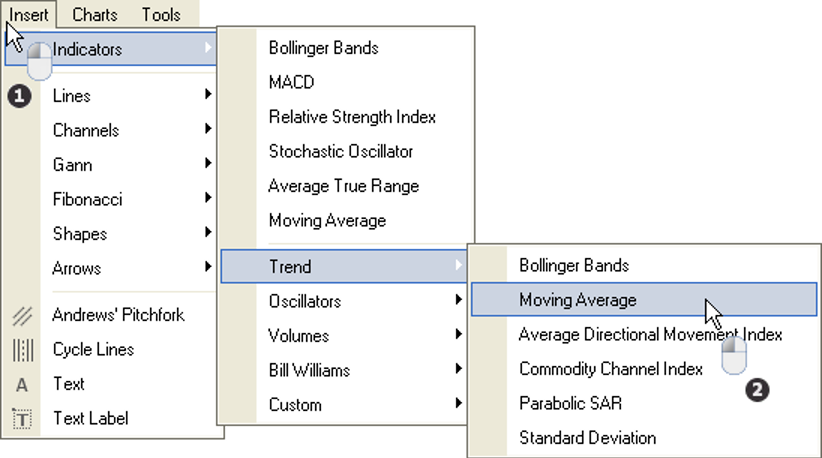
- After selecting Moving Average from the list above, a new window will pop up on your MetaTrader 4 trading platform. You will see 3 tabs on that window. In the Parameters tab, you can set your moving average value on the period box (which determines how long the average will be), choose your preferred MA method, and select what this will apply to.

- In the Level tab, you can set a channel with the main Moving Average. Click on Add, then double-click on Level and put the distance value from your Moving Average. This option is not compulsory. You can avoid this parameter or keep the value 00.

- Finally, in the ‘Visualization’ tab, you can see the time frame where you can use this moving average. If you select ‘All timeframes’, you can see your MA on all time frames.

- And that’s it! Click OK, and voila, just like that, you have a simple moving average on your chart.
Removing Technical Analysis Indicators from MT4
Let’s say you don’t want to use a specific indicator anymore or simply don’t want it visible on your chart. Here’s how to do it.
- Right-click anywhere on your chart
- From the dropdown menu, select Objects List
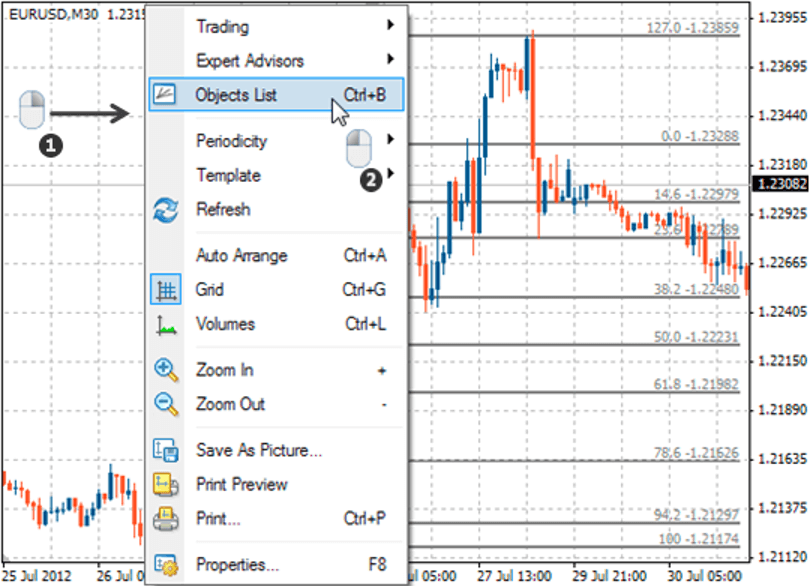
- Select the indicator you wish to delete (in our case, this is Fibo)
- Hit the Delete button
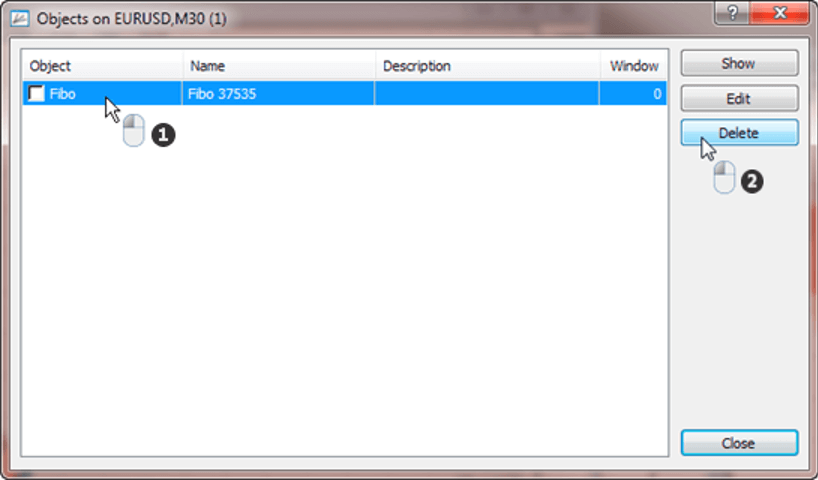
- And that’s it. The indicator will now disappear from your chart.
Summary
In summary, adding custom Indicators to a trading platform is not rocket science. After you have done it the first time, you’ll be equipped with the ability to add these trading tools whenever you want in a matter of seconds. It’s all about practice and knowing the technicals (bear in mind that the process works the same on mobile trading accounts).
Remember, technical indicators are the most effective and necessary tools for analysis and chart patterns. If you know how to use them, you can certainly become a better trader and gain an edge when trading stocks.
At the same time, the real problem is not adding the indicators. You can bookmark this post on your browser and visit it whenever you need. The challenge is to figure out how to correctly use each indicator so you can find price changes and identify trends in financial markets.
Whether you plan to focus on forex trading or stock trading, knowing how to use technical indicators is the most effective way to get reliable trading signals. Our advice – open a MetaTrader 4 (MT4) demo trading account and add all the indicators to a trading chart.

