What is Fibonacci in Stock Trading?
Fibonacci… Sounds like some sort of Italian pasta, doesn’t it? But worry not; we are still talking about stocks and the art of stock analysis. In fact, Fibonacci is one of the most popular technical indicators out there used to forecast possible future stock price movements.
Trust us, Fibonacci is a BIG deal amongst traders of all markets, so you better learn it and integrate it into your training strategy.
So let’s dig deeper into Fibonacci retracement levels and see how you should use them in stock trading.
The Origins of Fibonacci
The concept of Fibonacci was originally created to study the universe and spiral objects within nature (e.g., snail shells and the pattern of seeds and plants).
Crazy, I know! A tool created to study snail shells and plants became one of stock traders’ most popular tools. You can’t make that up! Leonardo Fibonacci had an ‘aha’ moment when he discovered a simple series of numbers that created ratios describing the natural proportions of things in the universe.
The Fibonacci ratios arise from the following number series: 0, 1, 1, 2, 3, 5, 8, 13, 21, 34, 55, 89, 144 and so on. These are also called the Fibonacci numbers. Wanna try it yourself? Remember to start a sequence of numbers with zero and one.
There are three main aspects when it comes to Fibonacci that we will cover within this lesson; Fibonacci Sequence, Fibonacci Retracement, and Fibonacci Extension. Let’s dig in!
What is the Fibonacci Sequence?
The Fibonacci sequence is one of the most famous mathematics formulas adapted for various practice areas. Simply put, the Fibonacci Sequence is a set of numbers where, after 0 and 1, every number is the sum of the two previous numbers. This continues to infinity.
But numbers speak louder than words (am I right?) So let’s take a look at what a Fibonacci sequence actually looks like in practice. Remember, the Fibonacci sequence is calculated by adding the two previous numbers together. It goes as follows:
1 1 2 3 5 8 13 21 34 55 89 144 233 377 …and so on. You can continue until it is not fun anymore, but we don’t recommend doing it.
Let’s move on to the important stuff. After the first couple of numbers in the sequence, if you measure the ratio of any number to the succeeding higher number, you will get the result of .618. If you measure the ratio between alternate numbers, you will always get the result of .382.
Now, if you divide any of the numbers in the series by the previous number, the result will be approximately 1.618. This ratio is also known as the Golden Ratio, Golden Mean, or Phi.
Anyway, enough with the math. Let’s take a look at the interesting bit and how you can actually use these numbers to make successful trades in the stock market.
Exploring the Golden Ratio
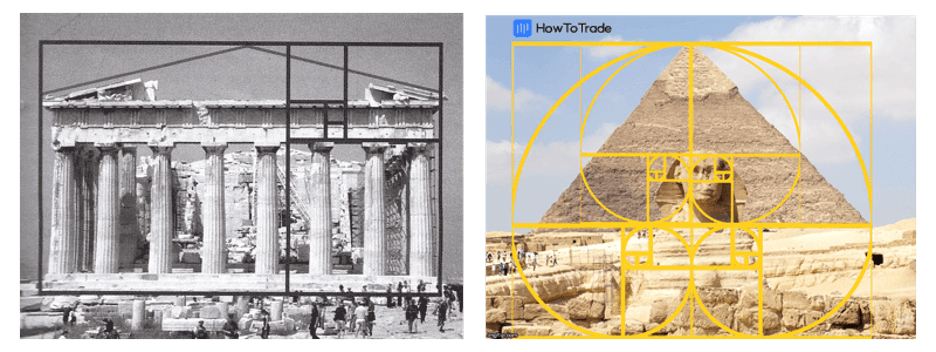
Fibonacci’s Golden Ratio can be found in areas of practice you would have never guessed. Design, architecture, art, photography, and so many others. Can’t believe it? Let’s take a look at some examples:
Architecture – The pyramid of Khafre and Ancient Greek architecture:
Art – Mona Lisa, and many more.

Photography

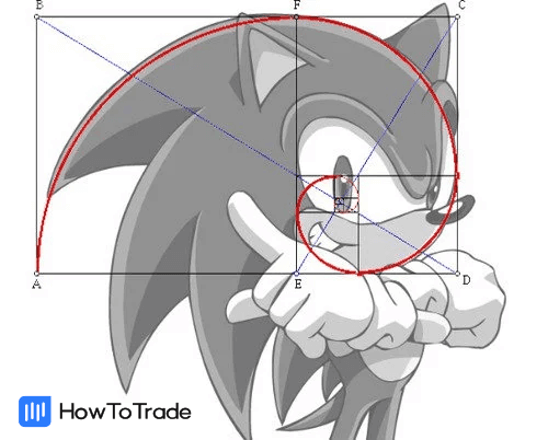
Famous logo designs
Sonic the Hedgehog
Apple logo
Twitter logo
Pretty awesome, right?
But how can all this help with your stock trading? Well, believe it or not, these levels are essential in finding your entry and exit points. I mean, after all, financial markets and trading are a part of nature.
What Are Fibonacci Retracement Levels (Fibonacci Ratios)?
So now that we understand what Fibonacci sequences are and how important these ratios are in nature and other fields, it’s time to delve into the role of Fibonacci numbers in trading. That comes down to one primary thing – Fibonacci retracement levels.
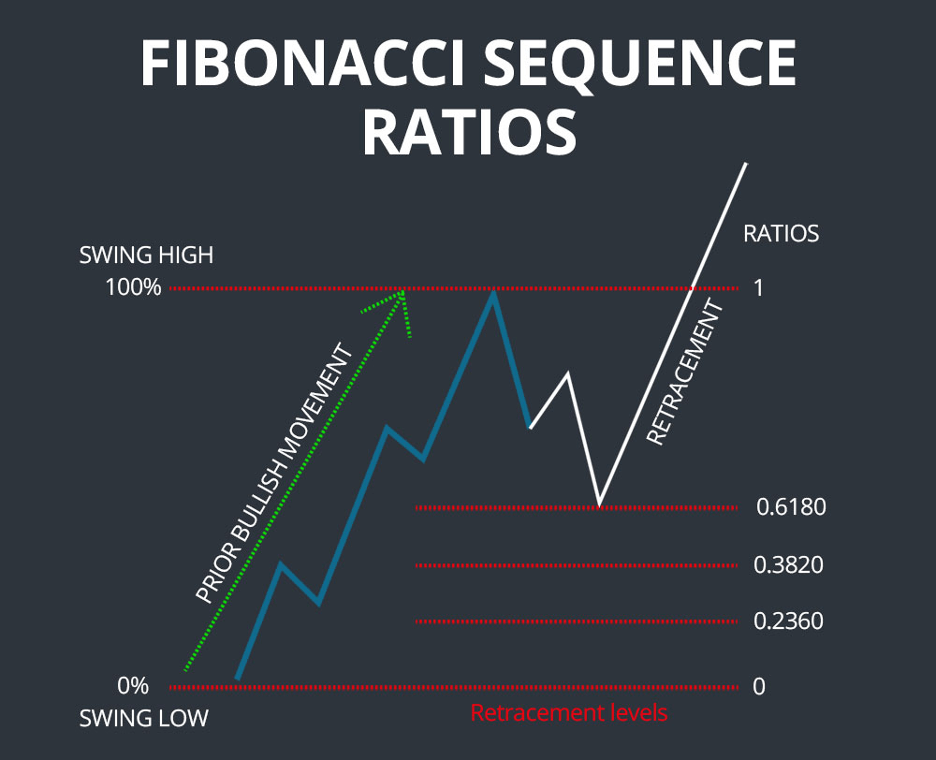
Fibonacci retracement levels (or Fibonacci levels in short) are a predictive technical indicator used by stock traders to perform technical analysis. The theory is that once the price begins a new trend direction, it will most likely return – or retrace – part way back to the previous price level before resuming in the original direction.
Stock traders and investors use these Fibonacci retracements as potential support and resistance areas as they believe it works best when the market is trending. As a stock trader, these are the levels that will be important to YOU, and you will most likely highlight them on your chart – 0.236, 0.382, 0.618, 0.764.
Because these levels are inflection points, traders expect some type of price action, either a break or a rejection around these levels. Furthermore, as many traders follow these numbers, they are clearly more important in the market.
Fibonacci Retracement Levels on a Chart
Okay, let’s get practical.
The first thing you must know is how to draw Fibonacci retracement levels. Drawing Fibonacci retracement levels requires stretching the indicator from the swing high to the swing low of a specific trend. It means you need to identify a trend in any time frame and find the high and low points of the movement. Then, you can create Fibonacci retracement levels.
Now, if Fibonacci retracement levels are based on a bullish movement, they indicate potential support levels where a downtrend will reverse bullishly. On the other hand, if the retracements are based on a bearish trend, they indicate potential resistance levels where a rebound will be reversed bearishly.It looks like this when the lines are drawn.
The Fibonacci retracement reversals most commonly occur at the 38.20%, 50%, and 61.80% levels. Note that the 50% retracement level is not a Fibonacci ratio. Still, many traders often use it as a different theory that suggests that, on average, stocks retrace half their prior movements).

Fibonacci Retracement Levels Trade Example
In this section, we will show you an example of Fibonacci retracement levels on a price chart. So, say your stock is trading at $400, and 61.8% of the previous move is $5, then a trader might look at $405 as a target price for the stock and think about exiting if the price reaches that Fibonacci level.
Because, at this level, the Fibonacci extension theory suggests that price might retrace and move lower.
Now, let’s see what this looks like on an actual stock chart. Remember, the horizontal lines represent the Fibonacci levels, and we stretched two Fib retracement levels on two different price swings, meaning trends.
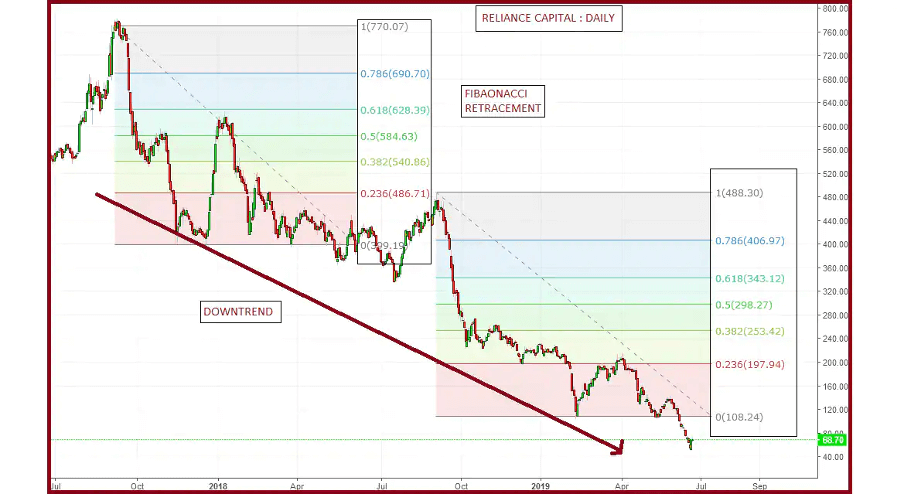
Not too bad, right? As you can see in the above chart, the markets tend to react to Fibonacci retracement levels, and prices typically hover around Fibonacci levels before the next move.
When the stock price moves in the trend’s direction without any correction, it’s called impulse. When the market pulls back and pushes against the trend before continuing in the direction of the trend, it’s then called pullbacks.
Taking the example above – on the first downtrend price swing (on the left), we can see that the price moves in the same direction without stopping at Fib levels, creating an impulse wave. Then, the price pullback at the 61.8% Fibonacci retracement level before continuing in the primary direction.
What Are Fibonacci Extension Levels?
Another vital factor in understanding Fibonacci levels is their extension ratios. These ratios show potential profit targets if the price moves beyond the Fibonacci retracement levels.
The most common extension levels used by traders are the same as the retracement ratios and are 1.61, 1.50, 1.38, 1.00, 0.618, and 0.0382. These levels can help traders and investors to determine potential zones and identify key levels where the current breakout is likely to end and change direction or a zone for the price to have a slight pullback and then resume its trend.
Summary – Trading Stocks with Fibonacci Retracement Levels
As useful as Fibonacci retracements are, it is essential to remember that the retracement lines ultimately represent potential support and resistance levels.
Notice how we highlighted potential? That’s because the Fibonacci retracement lines represent price levels at which one should be alert rather than hard buy and sell signals.
What’s more, it is super important to use additional technical indicators when trading with Fibonacci levels. The more those indicators and repetitive trend reversal chart patterns point towards a reversal; the more likely one is to occur.
In sum, the Fibonacci retracements trading strategy is an effective trading method, and mastering this technique could benefit you. All that is left for you to do is learn how to add these magic numbers to your trading platform and start using the Fibonacci Retracement tool.


Trade 1 Lot for just $2.5 commission*
- Trade 1,000’s of global markets.
- 0% deposit and withdrawal fees.
- Rapid funding turn-around times.
- Trade on MetaTrader 4 and 5.