What is Multiple Chart Frame Analysis?
Some say, when you are a Forex trader, you sleep like a baby – you wake up every hour and cry! Fortunately for you, HowToTrade comes to the rescue, helping you improve your chances of becoming a profitable trader and sleep like a tired adult!
Now, two questions come to mind: do you trade exclusively in a single time frame? Or do you prefer to place things into a manageable context by looking at the bigger picture? If so, understanding how different time frames give us different information is a necessary skill.
Either way, finding the right time frame for your trading is not an easy task. However, integrating multiple time frames into your trading is not just a good idea, it’s a great one! So, let’s dig into the concept of finding the right time frames for your trading style.
After all, that’s what we are here for; to help you find yourself as a Forex trader and provide you with the best tools to conquer the market. No matter if you fancy trading from a one-hour chart or a monthly chart, we’ll help you understand why it may be profitable to reference both.
Are you ready to get started on multi-timeframe analysis? Outstanding! And, don’t worry, it won’t bite. Besides, we’ll be holding your hand through the entire process and go nice and slow.
How Do I Trade Using Multiple Time Frames?
Multiple time frame analysis is the process of monitoring the same forex pair in different time frames. Usually, the larger time frame is used to establish a longer-term trend, while a shorter time frame is used to spot ideal entries into the market. Think of it this way: the longer time frame is the view from 10,000 feet while the smaller time frame chart is a worm’s-eye perspective. Both are inherently useful and give us an abundance of information.
When you use a pricing chart, you’ll notice that there are different time frames being provided, ranging from 1-minute charts right through to 1-month charts. Each is a unique view of the market and illustrates price movement on different scales.
The various periodicities may be marked as M, H, D, W and MN. “M” is short for “minute”, “H” is short for “hour”, “D” is short for “day”, “W” is short for “week”, and “MN” is short for “month”. Also, different durations may be combined with each period. A good example of this in forex is the four-hour chart, which is abbreviated 4H.
What’s the Need For All These Different Time Frames?
In reality, each trader views the market in a specific fashion. Thus, there is no need for every trader to review every time frame. However, different Forex traders have distinct views on how a pair is trading and all perspectives can be completely correct. But, your strategy will dictate which time frame is the strongest reference by which to achieve your objectives.
For instance, if you follow the methodology of swing traders, then a monthly, weekly, and daily chart will be more useful than a 1-minute chart. This is a key point in all strategies, be it reversal, rotational, or trend trading.
Case Study: Observing Price Movement on Each Time Frame
To illustrate, assume that Andrew sees that the EUR/USD is trending south on the four-hour chart. However, Max trades on the 15-minute chart and sees that the pair is just ranging up and down. The truth is, neither trader is wrong; they are both correct! That is the key to multi-timeframe analysis – any technical analysis isn’t necessarily wrong, but simply addresses a different perspective.
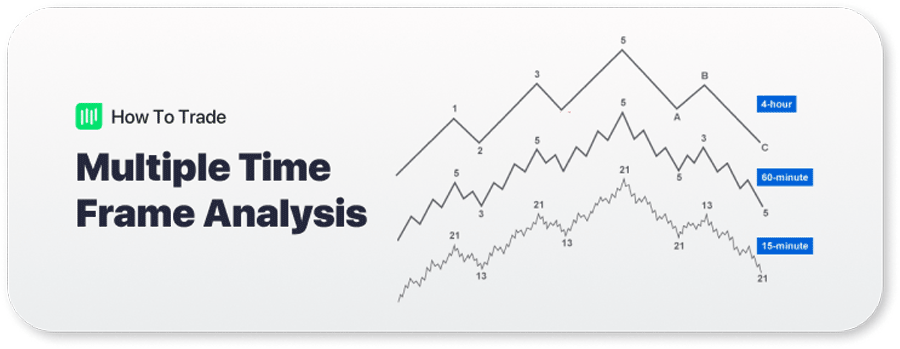
Let’s see what I mean by that below by taking a closer look at the same currency pair but on 3 different time frames: the four-hour chart, the one-hour chart and the 15-minute time frame.

Ultimately, there are a few key observations:
- Notice the 60-minute chart above. The market appears to be in a downtrend after it completed a failure swing.
- Now, take a look at the 4-hour chart. In this time frame, we can clearly see that only the wave is down but the trend is still up. This is a key element of trend trading; understanding when price action is simply pulling back, not reversing completely.
The point is, if we just looked at the 60-minute time frame we probably would have sold at the point where the market would recommence its uptrend. As you can see, this poses a problem. That’s why we have to own risk when we trade; if our analysis proves incorrect, then we are in a position to lose money.
Traders sometimes get confused when they look at the 4-hour timeframe, see that a sell signal, then hop on the 1-hour and see the price slowly moving up. Swing traders can easily fall prey to this problem as their multi-timeframe analysis is based on charts with longer durations. No doubt about it, the contradictory price action can certainly muddy the waters!
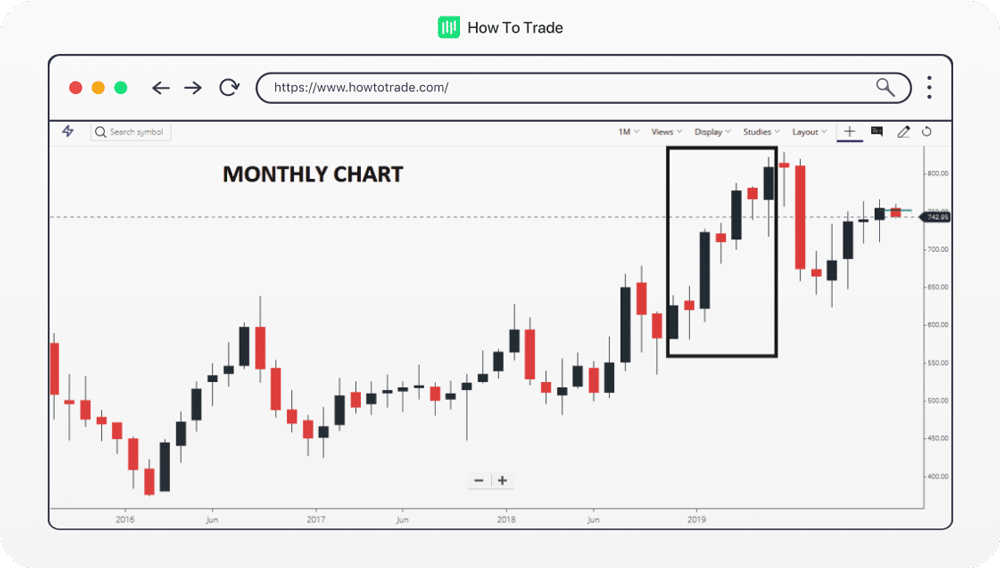
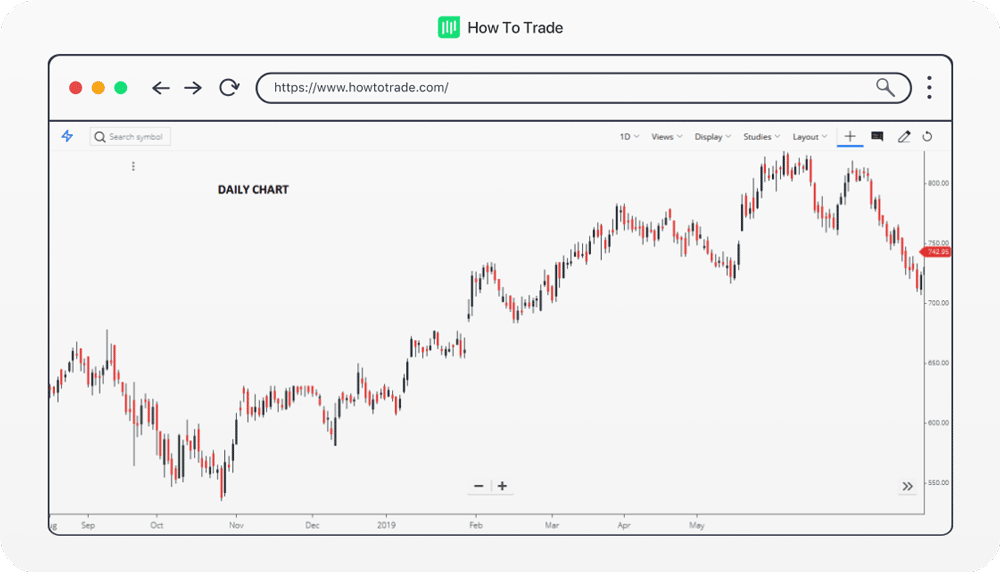
Let’s take a look at another example of the same currency pair but in different time frames. This time we will look at the EURUSD pair in a Monthly, Weekly, and Daily time frame. From a practical standpoint, these chart periodicities are more relevant to swing traders.
Monthly Chart View

Weekly Chart View

Daily Chart View

The patterns and trends look pretty different, eh? Or do they? If you notice, the price is moving broadly in the same direction. That’s why it’s crucial to incorporate other indicators into your multi-timeframe analysis. One way to do this is by applying Fibonacci retracements to quantify the market state. In this way, we can identify the overall market direction and not get caught up in the “noise” of the daily time frame.
Of course, the easiest thing to do would be to flip a coin to decide whether to buy or sell. But, we are not about the easy solutions here. We want you to make REAL money! And, the way to do it is by knowing how to analyze and interpret multiple time frames to your advantage.
Getting Started With Multi Time Frame Analysis
Remember, your best time frame is the one that compliments your strategy and available resources. If you’re an average retail trader, using monthly charts to locate stop losses and profit targets doesn’t make much sense. Be sure that your forex trading time frame is conducive to generating positive returns by holding risk in check. If not, sustaining profitability will prove to be an epic task!
So, should I use a long-term chart or look to an intraday time frame to make trades? That’s truly the million-dollar question! Click Next to learn more about the best time frame to trade in.


