Inner Circle Trading is one of the most popular trading philosophies. It attempts to mimic Smart Money’s trading behavior. And what and who is smart money? The market maker, the big banks, the institutional traders, the large hedge fund managers, and pretty much any market participant with enough money to force prices to move in their direction.
Based on that notion, Inner Circle Traders (ICT) understand that Smart Money often manipulates price action to take advantage of retail traders, who are usually numerous average traders with smaller capital. So, by mimicking Smart Money traders, Inner circle traders aim to escape the fate of the rest of the retail traders.
For this to work, though, Inner Circle traders must learn some concepts that describe Smart Money’s trading behaviors. Michael Huddleston was the person who first taught these smart money concepts, which are widely used today. His YouTube channel has hundreds of hours of video content showing these concepts.
In this piece, we describe some of the most important ideas described by Huddleston.
The 14 Key ICT Concepts
The following are some of the most important and commonly used concepts in ICT trading.
1. Liquidity
Perhaps the most important concept in the ICT trading domain is liquidity. Many ICT traders decide whether or not to trade based on where they find liquidity.
Liquidity comes in two forms: Buy-side liquidity and sell-side liquidity. Buy-side liquidity refers to areas where most short-selling traders will likely place their stop losses. Sell-side liquidity refers to areas with clusters of bullish traders stop orders. On the charts, these levels are most commonly at support (double/triple/multiple bottoms) and resistance (double/triple/multiple tops) levels, the highest and lowest price points within a trading session, day, or week, and trendlines.
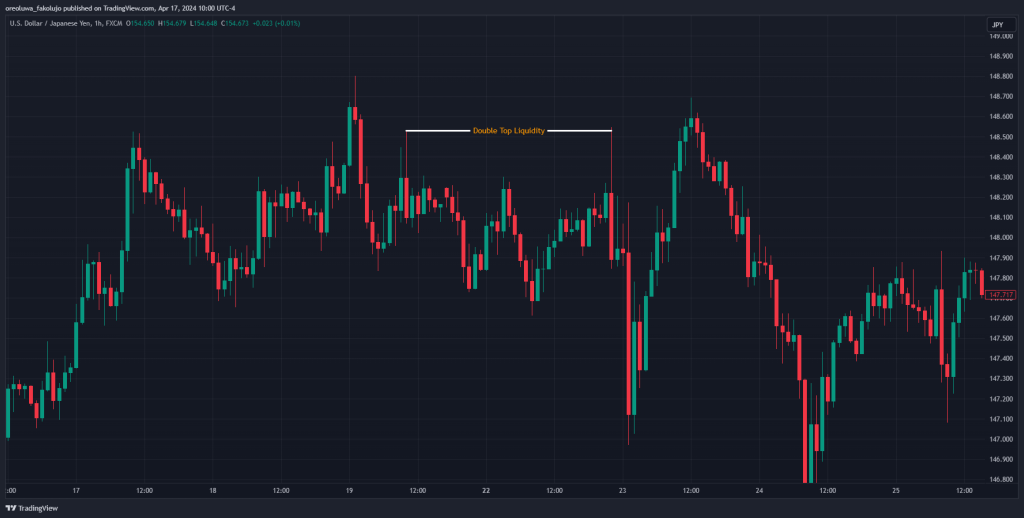
This concept postulates that smart money traders know where these clusters of stop-losses/liquidity are, and they are fond of manipulating the price to take these retail traders out to make their profits before forcing the price in the opposite direction to take out more liquidity. For instance, they often know that round numbers are being used by many large institutions. Let’s say, for example, if the USD/JPY is trading near 150, which is known as a crucial level for the pair, then it is very likely that some traders will place their orders around this price level.
So, by imitating smart money traders, ICT traders try to predict where there are liquidity pools and create their trading systems around them.
2. Fair Value Gaps
FVGs are some of the most commonly used concepts in ICT trading. Perhaps one of the reasons for their popularity is how they’re straightforward to spot on the chart.
An FVG is always a three-candle formation. In a bullish scenario, it refers to the gap between the first candle’s high and the third candle’s low. And in a bearish scenario, the fair value gap is the gap between the low of the first candle and the high of the third candle.
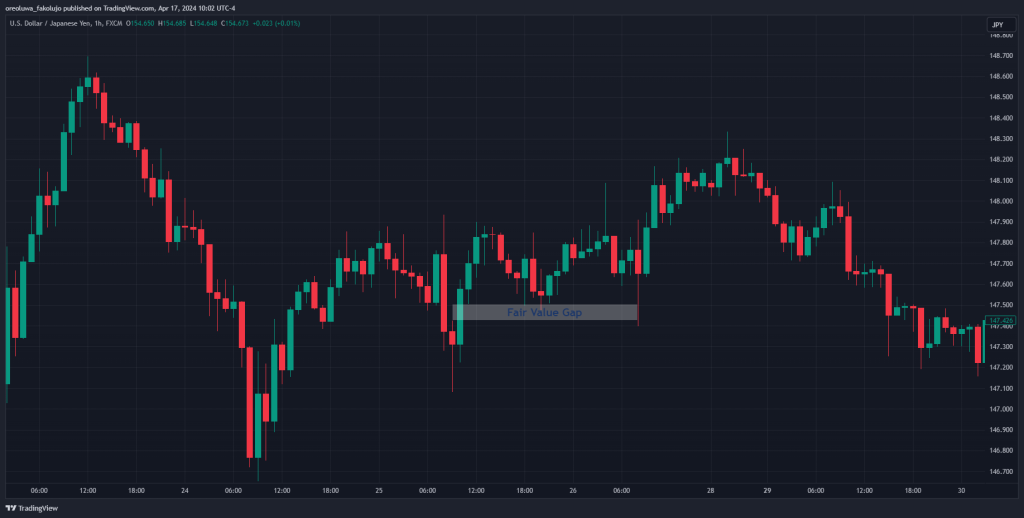
The idea behind fair value gaps is that price often comes back to fill those gaps—maybe not immediately, but eventually. Other names for fair value gaps are imbalances or inefficiencies.
3. Order Blocks
Order blocks are not just random zones on a chart. They are key concepts that appear as a result of the footprints of smart money, the big banks, and institutions that move the market. And they are areas where the price is likely to reverse in trading.
In other words, an order block is a zone where big banks and institutions have placed many buy or sell orders in the past. You’ll often see them as a long-range before a move upward or downward. They can also be the last bullish or bearish candles before an impulse in the opposite direction. Some other traders will also draw the order block as the last small candlestick before an impulsive move in the same direction.
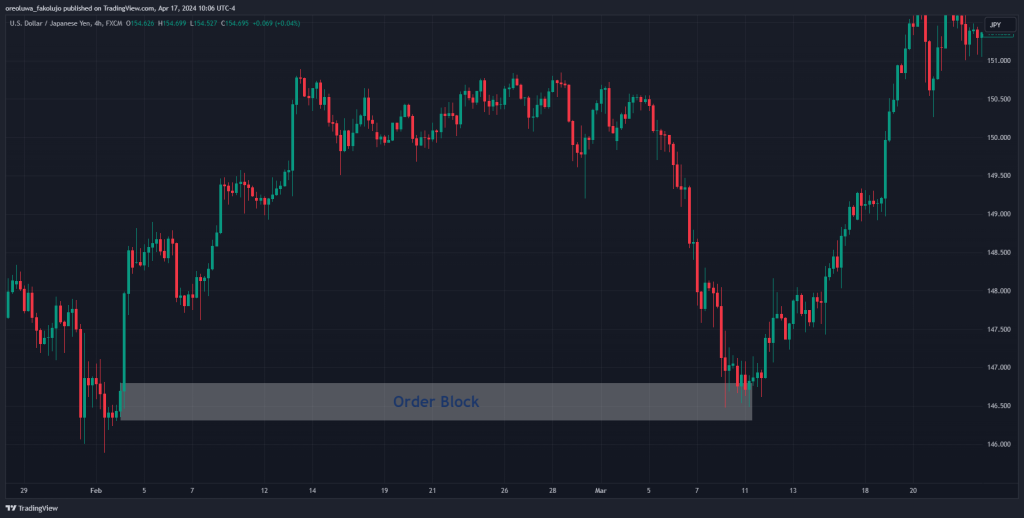
The main idea behind order blocks is that price tends to react when it gets to them. For instance, a bullish order block forms a demand zone from which the price may reverse to the upside in the future. Similarly, a bearish order block forms a supply zone from which the price may later reverse to the downside in the future.
4. Breaker Blocks
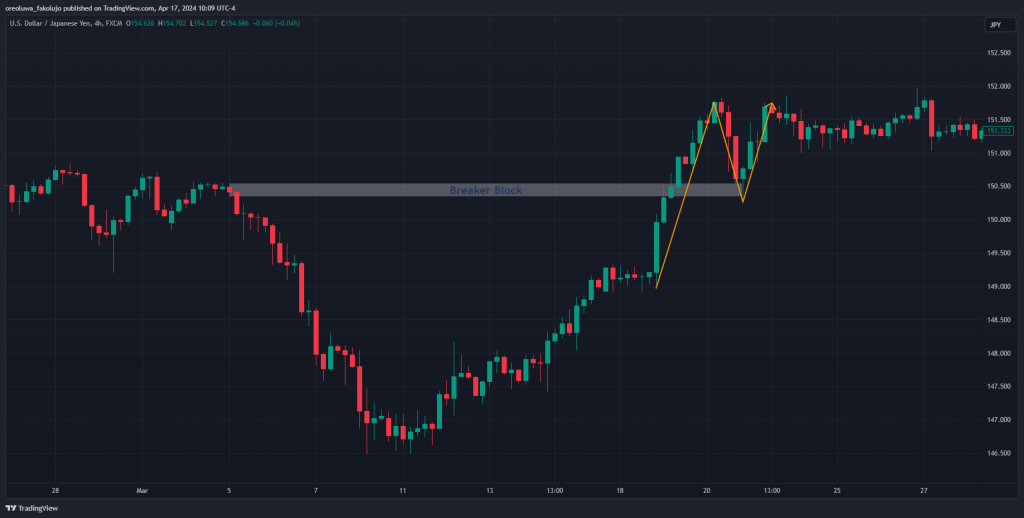
When an order block fails to cause the price to reverse, it has not yet failed completely. It can still be a breaker block.
A breaker block is a failed order block that eventually leads to a notable market structure shift. Like order blocks, breaker blocks tend to reverse the price in the direction they came from.
For instance, a bullish order block fails when it fails to reverse the price back in a bullish direction. Instead of discarding that order block, you can extend it to the right because there’s a possibility the price returns to it from below and gets reversed again to the downside. And so, a bullish breaker block is a bearish order block that failed. And a bearish breaker block is a bullish order block that failed.
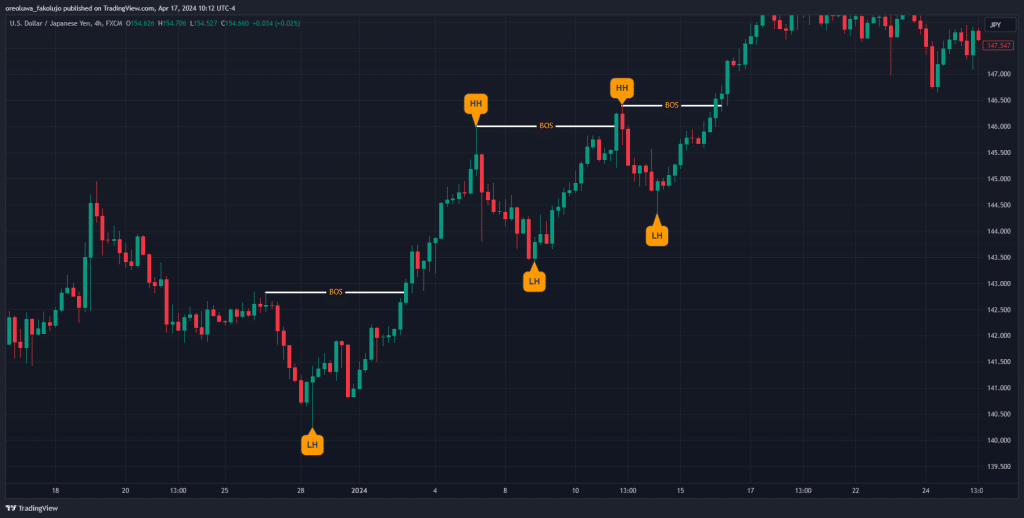
5. Break of Structure
Break-of-structures are a way for ICT traders to make sense of market trends. This ICT concept describes when the price surpasses the most recent high or low, followed by a pullback. This structure forms higher highs and higher lows in a bullish scenario and lower higher highs and lower highs in a bearish scenario.
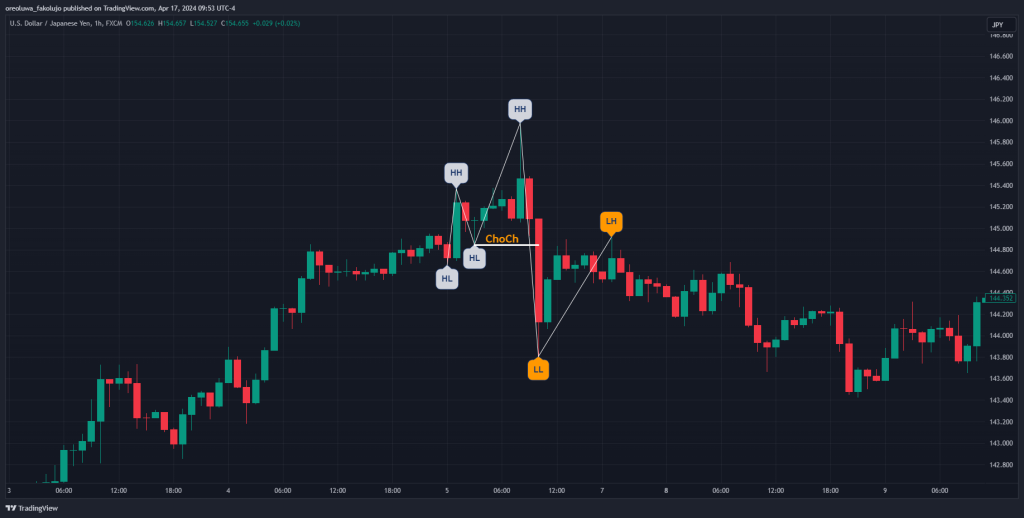
6. Change of Character
A Change of Character is one of the many ways smart money concept traders use to confirm a change in the flow of orders in a financial instrument. As such, it’s a common trade entry used by many ICT traders.
Simply put, during a prevailing bullish trend, a Change of Character happens when the price breaks below the most extreme demand zone right after breaking structure to the upside. And in a prevailing bearish trend, the Change of Character happens when the price rises above the most extreme supply zone right after breaking structure to the downside.
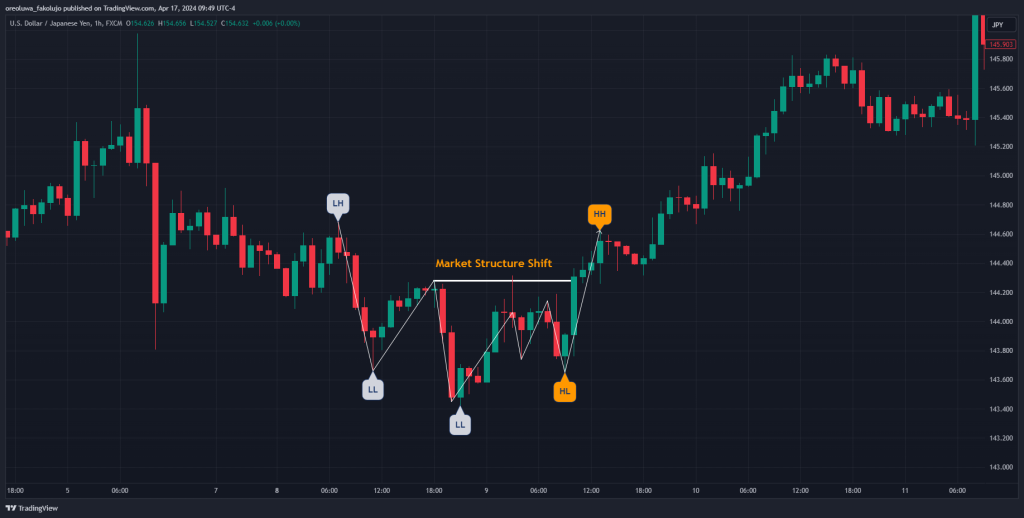
7. Market Structure Shift
Market structure shifts are similar to Change-of-Characters because they confirm the change in the flow of orders in a financial instrument. However, a small detail marks a clear difference between the two.
In a bullish scenario, a market structure shifts when the price falls below an extreme demand zone. However, it does this before necessarily breaking the structure to the upside. Similarly, a market structure shift in a bearish market refers to when the price reverses to rise above an extreme supply zone without first breaking the structure to the downside.
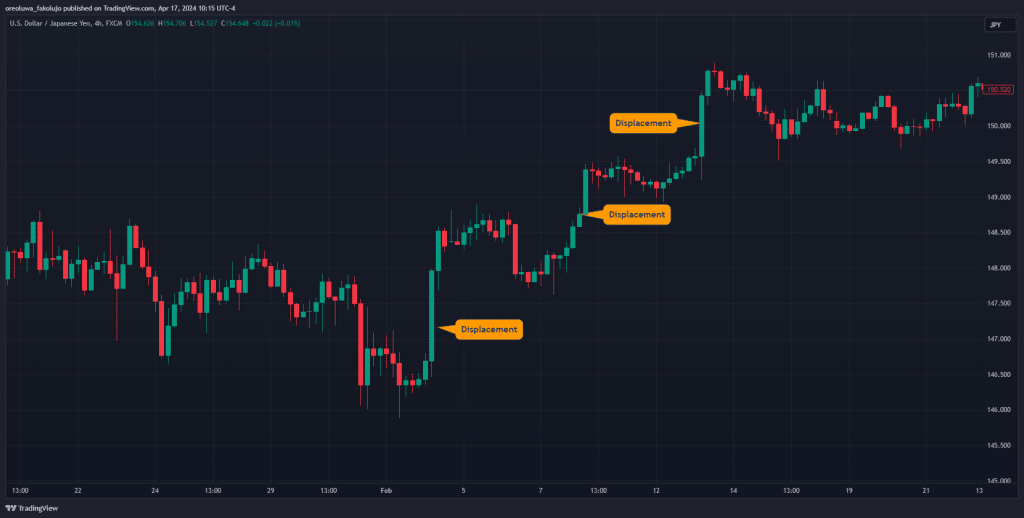
8. Displacement
Displacement is an ICT concept that simply refers to a decisive move in a particular direction that occurs when there is a sharp increase in buying or selling pressure.
When a displacement happens, you’ll notice that the candlesticks tend to have longer bodies and shorter wicks.
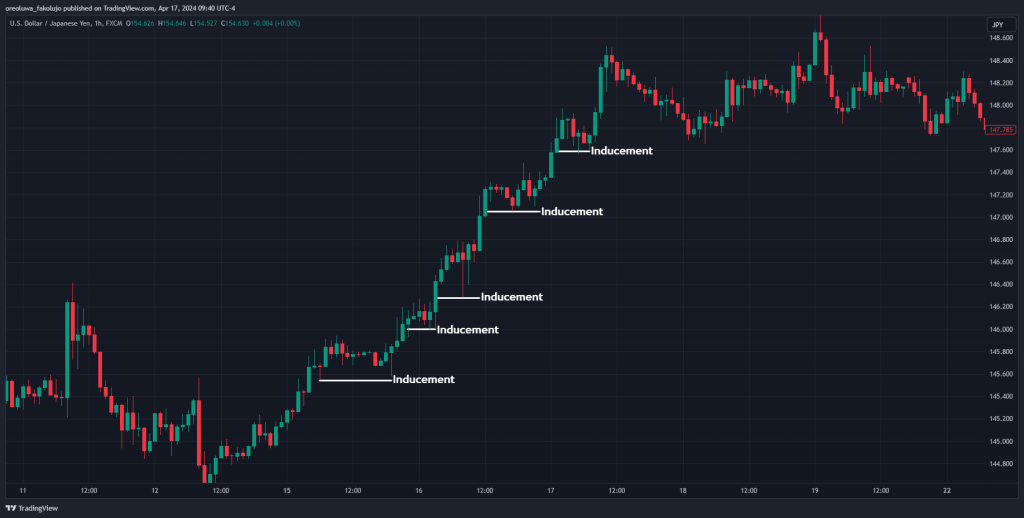
9. Inducement
Inducements are found on the mini counter-trends or pullbacks of a larger-scale trend. They are created by the hunt for lower timeframe liquidity hunt by the smart money market participants. For instance, while the price is making a larger bullish push, it’ll often make minor pullbacks to liquidity pools on the lower timeframe before continuing its bullish push.
ICT traders use this concept by seeing inducement levels as part of liquidity and expecting the price to eventually remove them.
10. Optimal Trade Entry (OTE)
The OTE in ICT trading refers to the area in price action where a trader is likely to be exposed to the least risk without also risking being left out of a trade when placing limit orders.
The Inner circle trader often uses the Fibonacci retracement tool, and this level often falls between 61.8% and 79% of the Fibonacci tool. This means when the price retraces from, say, a bullish leg, the optimal trade entry falls between the 62% and 79% (specifically the 70.5%) Fibonacci price levels of the leg, which is closer to the beginning of the bullish leg. From this zone, you can look for continuation trades for further upside movements.
| Fibonacci Retracement Level | Description |
| 0 | First Profit Scale |
| 0.5 | Equilibrium |
| 0.62 | OTE Boundary 1 |
| 0.705 | OTE |
| 0.79 | OTE Boundary 2 |
| 1 | Starting Position |
| -0.5 | Target 1 |
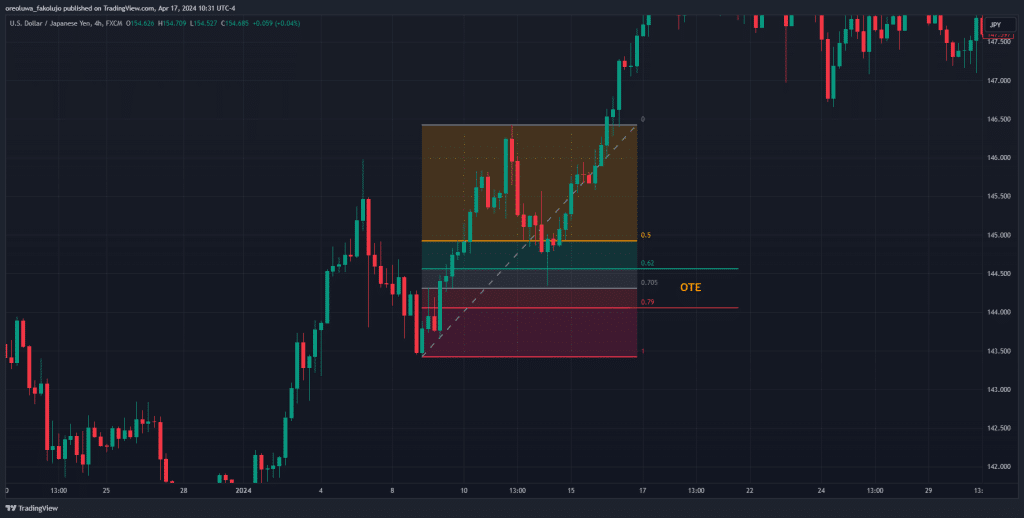
The above image is what an optimal trade entry looks like on a price chart.
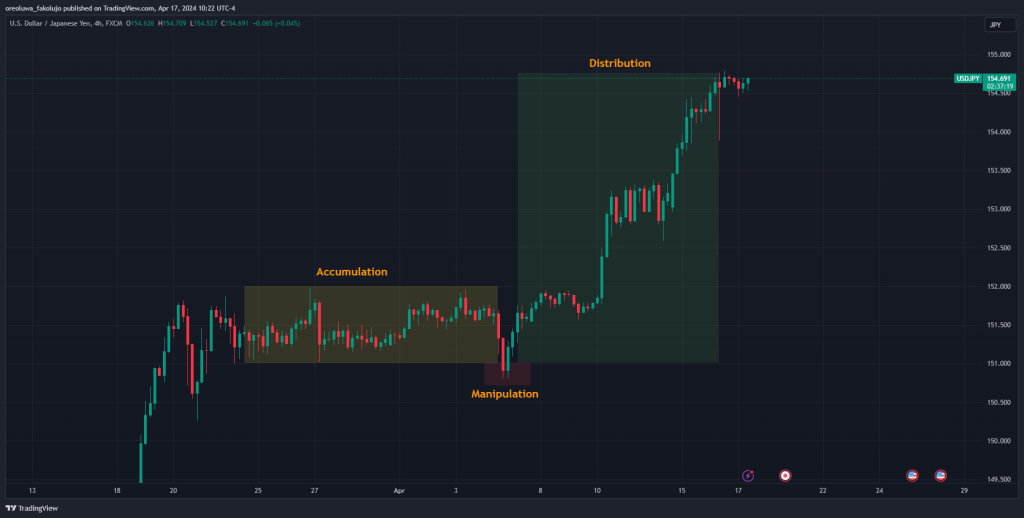
11. Power of Three (Accumulation, Manipulation, and Distribution)
The power of three refers to Accumulation, Manipulation, and Distribution and describes three stages of price movement. Every candlestick comprises Open, High, Low, and Close (OHLC) price points. The Open and Close prices form the body of the candle, while the High and Low form the wicks. The Power of Three is an ICT methodology that describes how lower timeframe movements form each candle on the higher timeframe.
The accumulation is the first stage, starting with the price ranging between two levels. While this range is ongoing, retail traders who intend to take advantage of the sideways movement place stops above and below the range.
The second stage is manipulation, where the price suddenly breaks out of one side of the range, taking out the stop losses of retail traders on that side.
Finally, the distribution happens, which is the big move where the price reverses to take the liquidity from the opposite range after taking out one side of the range. Usually, this huge move forms the body of a candlestick on a higher timeframe.
On close observation, the Power of Three (AMD) concept matches the narrative that big banks and large institutions with large enough pockets to move the market tend to manipulate it so that liquidity is hunted and taken out.
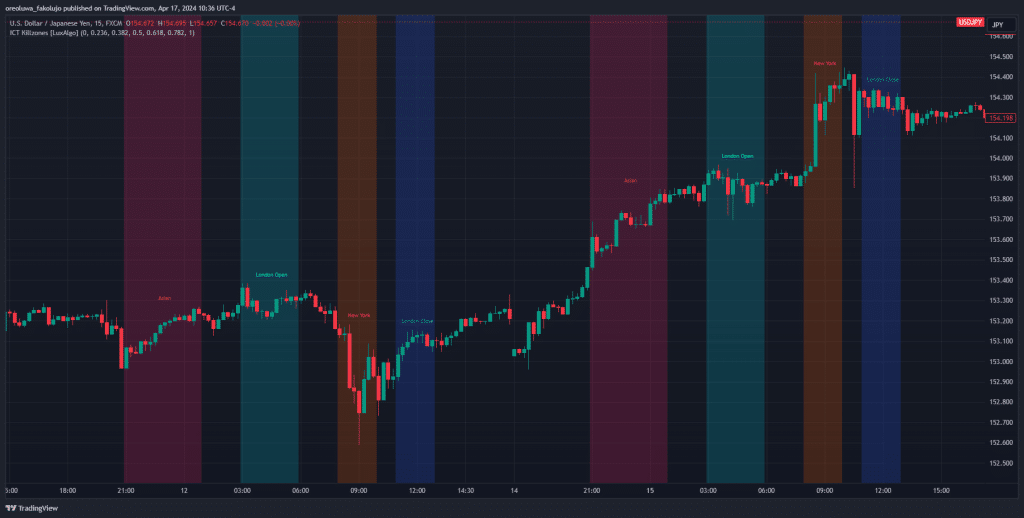
12. Killzones
Killzones are specific times when the market is most active and likely to act in a certain manner. This is an important aspect of many ICT trading strategies, such as Silver Bullet and Judas Swing, because if the price is likely to act in a certain way during these times, and you can predict this behavior, you can profit from it.
There are Killzones for every trading session and the best currencies to trade within those killzones. For the forex market, these are the Killzones:
| Killzone | Time (Eastern Standard Time) | Pairs to Trade |
| Asian Killzone | 8:00 PM to 10:00 PM | AUD, NZD, and JPY pairs |
| London Killzone | 2:00 AM to 5:00 AM | EUR and GBP pairs |
| New York Killzone | 7:00 AM to 9:00 AM | USD pairs |
| Londong Close Killzone | 10:00 AM to 12:00 PM | All major pairs |
13. Premium and Discount Arrays
ICT traders use premium and discount arrays to determine areas where entering the financial market offers the lowest potential for risk. First, you measure a move from its origin to its highest or lowest point. You can do this with the Gann Box of the Fibonacci Retracement tool. Then, you split this move into two halves.
In a bullish scenario, the upper half of the move is the premium zone, and the lower half is the discount zone. In a bearish scenario, the lower half is the premium zone, while the upper half is the discount zone.
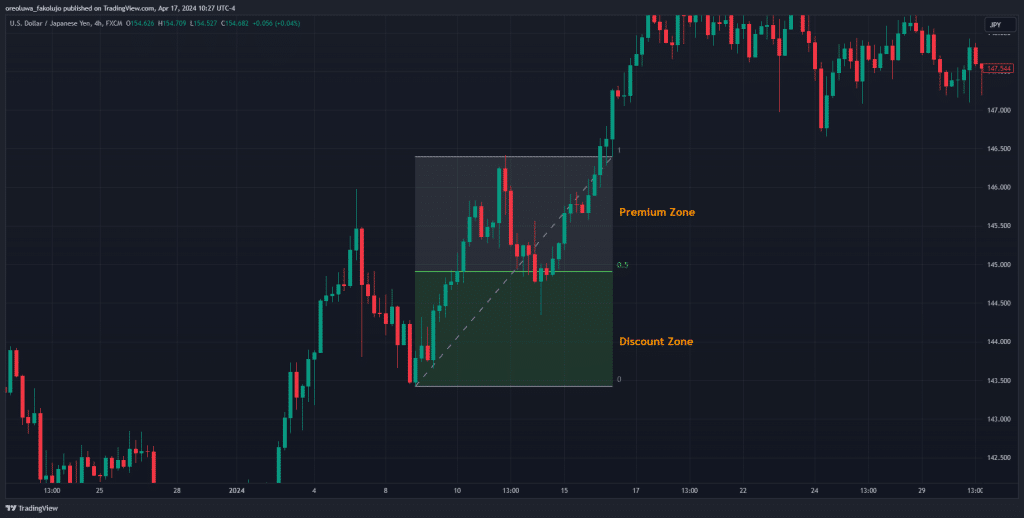
Entering trades in premium zones is riskier because these zones tend to be farther away from where your stop loss is likely to be (the swing low or high point). Discount zones, conversely, don’t require as much risk because they are usually closer to stop-loss levels.
14. Balanced Price Range
A balanced price range happens when the price makes a displacement move in one direction and almost immediately makes another impulsive move in the opposite direction. These movements often leave double fair value gaps behind, which may become important in the future as potential demand or supply areas.
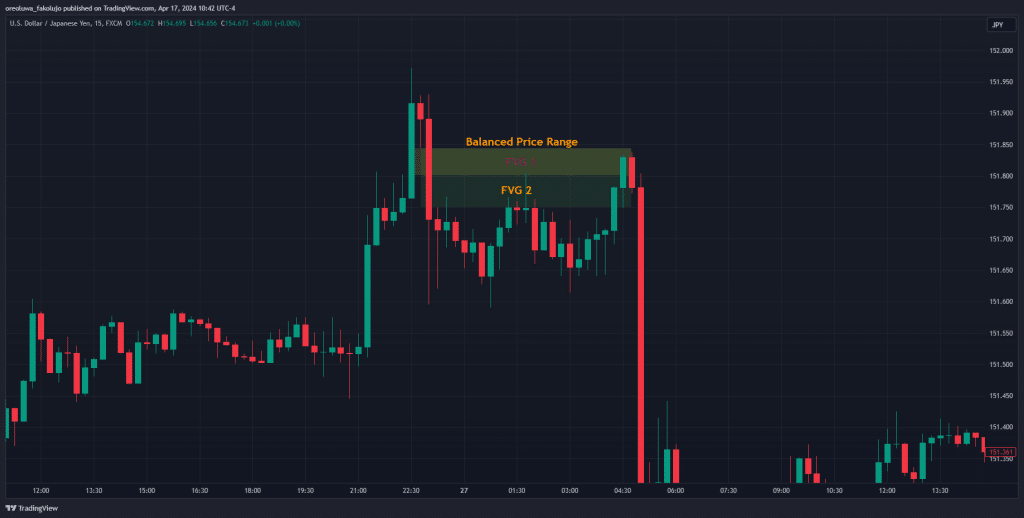
A bearish balanced price range will start with a strong bullish push with an immediate reversal with a strong bearish push. The FVGs of both moves coincide to form double FVGs, which act as price magnets. So, balanced price ranges are used as another form of supply and demand zones.
Check out our daily market analysis page for insights about leading FX pairs, global indices, and commodities.
Conclusion
In sum, many successful traders credit ICT trading concepts for their success. These concepts or theories can assist traders in identifying where the smart money is going, which, according to many analysts and traders, is a good indication to predict future price movements.
Yet, it is important to remind you that these concepts aren’t the holy grail of trading. You still have to find ways to combine them into a trading strategy with appropriate risk management measures before you can claim your success in the trading world. A good starting point is to learn and understand each one of the ICT concepts above. Then, you’ll have to take the next step to learn how to trade using the Smart Money Concept trading strategy.
Risk Disclosure: The information provided in this article is not intended to give financial advice, recommend investments, guarantee profits, or shield you from losses. Our content is only for informational purposes and to help you understand the risks and complexity of these markets by providing objective analysis. Before trading, carefully consider your experience, financial goals, and risk tolerance. Trading involves significant potential for financial loss and isn't suitable for everyone.