


EURUSD pauses right underneath the 1.07300 price level after recovering from a multi-month low of 106011. Investors await the release of the United States GDP report today and Core PCE data tomorrow to get a good idea of the Fed’s rate cut decisions.
Key Points
- EURUSD now marches into a bullish pullback after dropping to a 5-month low.
- All eyes are on the US GDP and Core PCE data today and tomorrow, respectively.
- The price now hangs underneath the 1.07300 level as a key resistance.
EUR/USD Daily Price Analysis – 25/04/2024
The market remained unfazed by the growth in the US durable goods orders on Wednesday. The data showed a significant increase from 0.7% the previous month to 2.6% in March. By the end of that trading day, the pair had only shed 0.03% of its price. A few hours into this European session, the price has gained 0.25%.
Perhaps what kept the lid on the pair on Wednesday was the equally bright result of the IFO survey of Germany’s business climate. The results showed an expansion to 89.4, more than the expected 88.9. Business expectations and Current assessments also beat what economists had anticipated.
Focus will now shift to the US GDP report for Q1 2024 today, where investors will be looking to glean insights into the Fed’s interest rate decision. The Initial Jobless Claims will follow suit, and tomorrow, investors will have more to consider when the US PCE data drops.
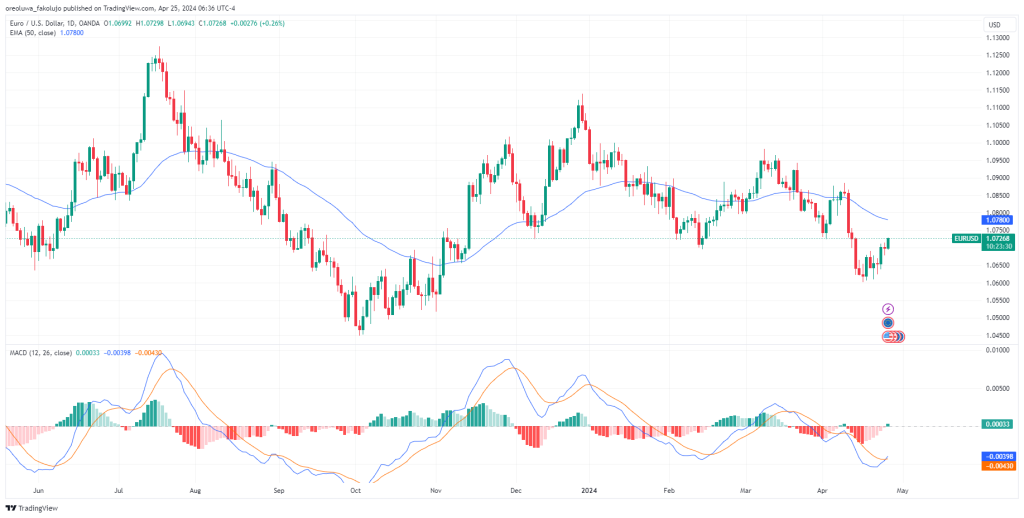
Technically, the price remains under the 50 EMA line as it makes a correction to the upside. And the MACD has just about printed its first green bar. Going by the 50 EMA, the outlook is bearish, but the MACD suggests we may be in a correction.
EUR/USD Intraday Price Analysis – 25/04/2024
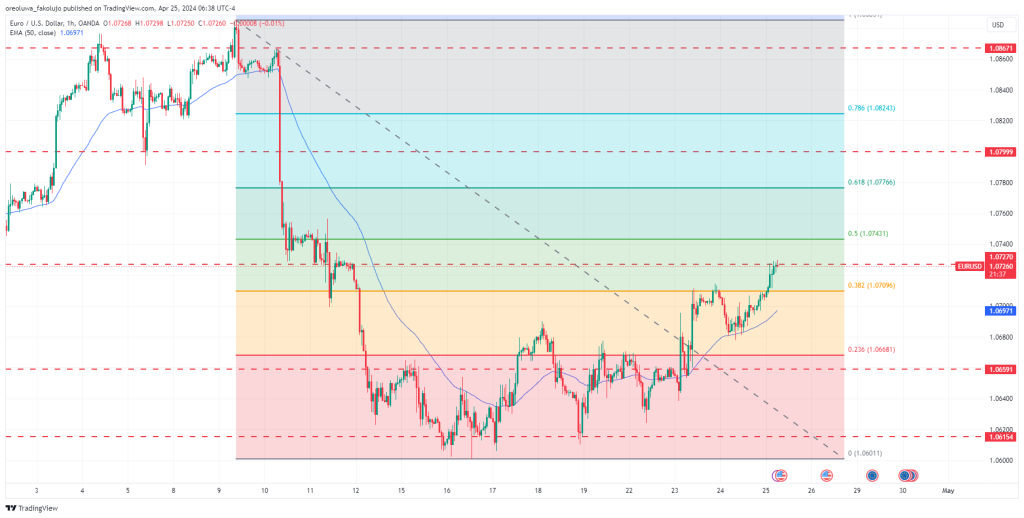
After a massive decline from the most recent peak of 1.08851, the pair came to rest at the 1.06154 support level before pulling back into the range. Drawing the Fibonacci Retracement tool from that peak to the most recent low, we see that the price has entered the pullback phase.
The pair hangs right underneath 1.07300, the midway point between the 0.382 (1.07096) and 0.5 (1.07431) Fibonacci levels. The continuation of the correction may push the price past the 0.5 (1.07431) Fib level and into the 0.618 (1.07766) Fib level.
If the pullback ends where it is now, the price will have to break through the 0.382 (1.07096) and 0.236 (1.06681) Fib support levels to challenge the 1.06011 swing low.
Key Economic Data for the EUR/USD Pair – 25/04/2024
The focus shifts to the US GDP today. Economists expect a contraction to 2.5% from last quarter’s 3.5%. If the data comes in better than expected, this may underpin the Greenback, potentially ending the pair’s bullish correction.
On Friday, the Core PCE data, the Fed’s preferred inflation gauge, will be released. A higher-than-expected figure could force the Fed to keep interest rates high, bringing downward pressure on the EURUSD. Conversely, lower-than-expected data could increase the rate cut buzz, potentially creating a headwind for the dollar.
EUR/USD Key Fibonacci Price Levels 25/04/2024
Based on the 1hr chart, the key Fibonacci price levels for EUR/USD are these:
| Support | Resistance |
| 1.07096 | 1.07431 |
| 1.06681 | 1.07766 |
| 1.06011 | 1.08243 |
Related Articles:
Risk Disclosure: The information provided in this article is not intended to give financial advice, recommend investments, guarantee profits, or shield you from losses. Our content is only for informational purposes and to help you understand the risks and complexity of these markets by providing objective analysis. Before trading, carefully consider your experience, financial goals, and risk tolerance. Trading involves significant potential for financial loss and isn't suitable for everyone.


