
The Dow Jones started the day at 39,345.53 but dropped to 39,318.78, with early trading subdued as investors awaited the key NFP release expected to show a moderate increase in employment figures for June.
Key Points
- Yesterday, the Dow Jones closed at 39,352.39, up 0.12%, reflecting optimism about a potential Fed interest rate cut.
- The NFP report, expected to show 190,000 new jobs and a 4% unemployment rate, will significantly impact market sentiment.
- The Dow is in an upward trend above the 200 EMA, with the RSI near oversold levels, suggesting potential short-term support or consolidation.
Dow Jones Daily Price Analysis – 05/07/2024
The Dow Jones Industrial Average closed at 39,352.39 on the previous trading day, opening at 39,324.74, marking a modest increase of 0.12%. This uptick reflects a cautious optimism among investors as signs of a softening economy have bolstered hopes for a potential interest rate cut by the Federal Reserve in September.
The week before featured a blend of economic data as factory orders dropped and the ISM Services PMI fell to its lowest level in four years. These data points underscore a weak economy which is one attribute on the speculation that says Fed could soften its monetary policy direction. The key indices gained modestly with the S&P 500 and Nasdaq led higher by low-volume trading ahead of July 4th but tech stocks provided their usual support.
The Dow started the trading day at 39,345.53 but had fallen to 39,318.78 as of this writing (a drop of +0.09%). The tiny pullback owes to investors being wary ahead of the key non-farm payroll (NFP) release available in pre-market trading. Early trading has been subdued as investors brace for the Labor Department’s data release, which is expected to show a moderate increase in employment figures for June.
Key Economic Data and News to Be Released Today
Today’s key economic event is the release of the NFP report at 8:30 a.m. ET. The consensus forecast is an addition of 190,000 jobs in June, down from the 272,000 jobs reported in May. An unchanged unemployment rate of 4% and a slight deceleration in average hourly earnings growth from 0.4% to 0.3% are also anticipated.
In the past, NFP numbers are typically better than expected which adds an interesting angle to Fed decision making. A robust jobs report might underscore the case against a rate cut, and conversely an above-expectations data could fuel expectations of monetary easing. In short, this data will be closely followed by market participants and it can create a lot of immediate impact on the market’s movements due its importance in dictating investors sentiment.
Aside from the NFP report, we could also listen out for comments coming through from New York Fed President John Williams. Insights into the Fed’s June policy meeting highlighted a cautious stance amid signs of economic slowdown and reduced inflationary pressures. This might just make a difference – Williams’ comments could offer more evidence as to the Fed’s path forward on monetary policy.
Dow Jones Technical Analysis – 05/07/2024
The Dow Jones (US30) is currently in an upward trend, with the price generally staying above the 200 Exponential Moving Average, which acts as a dynamic support level. Meanwhile, the RSI is bottoming at 38.15, indicating that the Dow is nearing oversold levels. There are clear areas of horizontal support and key levels to monitor if the price weakens further below this critical point for risk assets.
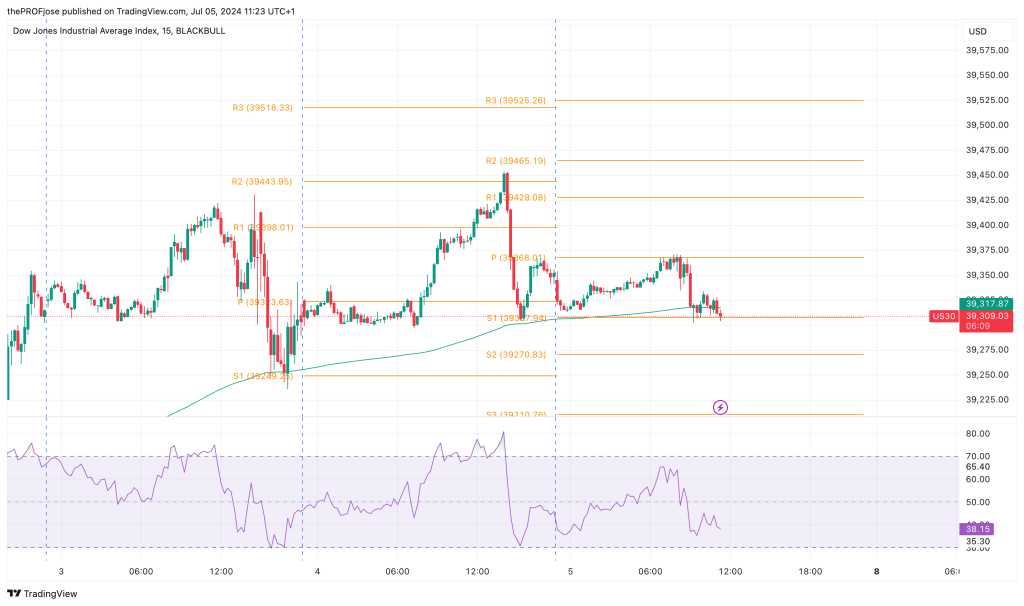
Given that the RSI is approaching oversold levels and the 200 EMA has not been breached yet, we could find some short-term support or consolidation before the next significant move.
If the price holds above the 200 EMA and the RSI starts to rise, it could indicate a continuation of the bullish trend. Conversely, a break below the 200 EMA, coupled with a continued fall in the RSI, could signal a potential for a deeper correction.
Dow Jones Fibonacci Key Price Levels 05/07/2024
Short-term traders planning to invest in US 30 today should keep a close eye on the following key price levels for the day:
| Support | Resistance |
| 39307.94 | 39428.08 |
| 39270.83 | 39465.19 |
| 39210.76 | 39525.26 |
Risk Disclosure: The information provided in this article is not intended to give financial advice, recommend investments, guarantee profits, or shield you from losses. Our content is only for informational purposes and to help you understand the risks and complexity of these markets by providing objective analysis. Before trading, carefully consider your experience, financial goals, and risk tolerance. Trading involves significant potential for financial loss and isn't suitable for everyone.