


Natural gas prices today showed a modest rise to $1.803 from an opening at $1.798, driven by anticipated increased demand due to warmer forecasts in the eastern U.S. and ongoing supply issues at the Freeport LNG facility.
Key Points
- European natural gas prices dropped due to high inventory levels despite recent cold weather.
- Economic data shows a tighter gas supply and a significant drop in U.S. drilling rigs, hinting at future production constraints.
- Technical analysis indicates a bullish trend for natural gas, though an overbought RSI suggests potential near-term correction at the $1.801 resistance level.
Natural Gas Daily Price Analysis – 23/04/2024
Yesterday, U.S. natural gas futures closed at $1.791, marking a 2.23% increase from the open of $1.765. The rise was supported by several key factors, including increased feedgas to the Freeport LNG export plant and a notable drop in output, which outweighed forecasts of lower demand and milder weather.
Internationally, European natural gas prices declined, driven by high inventory levels and reduced concerns about supply disruptions, despite recent cold conditions across the continent.
Today, natural gas prices opened slightly higher at $1.798 and have currently edged up to $1.803, reflecting a modest increase of 0.67%. The movement today is influenced by the expectations of increased demand for natural gas for electricity as forecasts predict warmer weather in the eastern United States, which could elevate air conditioning usage. Moreover, ongoing challenges, such as the reduced capacity at the Freeport LNG facility due to maintenance and damage-related shutdowns, continue to impact supply, supporting prices despite ample inventory levels.
Economic data released last Thursday by the U.S. Energy Information Administration (EIA) revealed that utilities injected 50 billion cubic feet of gas into storage, which was below the expected and average amounts for this period, hinting at a tighter supply than anticipated.
Key Economic Data and News to Be Released Today
The market will keenly await the next EIA weekly report and any developments on the European sanctions on Russian LNG, which could significantly sway market sentiments. Traders should also monitor the weather forecasts and any changes in LNG output levels from major facilities like Freeport LNG.
High-impact economic data due later today includes updates on U.S. Global Manufacturing PMI, Global Services PMI, and production levels, which could provide further direction to the market US Dollar and Natural Gas prices.
Natural Gas Technical Analysis – 23/04/2024
Natural Gas is currently bullish, maintaining a position above the 200 EMA. This trend suggests strong upward momentum, indicating sustained buyer interest.
Despite the bullish trend, the RSI points to an overbought situation, hinting at a possible short-term downturn. The immediate resistance is observed at $1.801, and any reversal from this level could signal a corrective phase due to overextended buying.
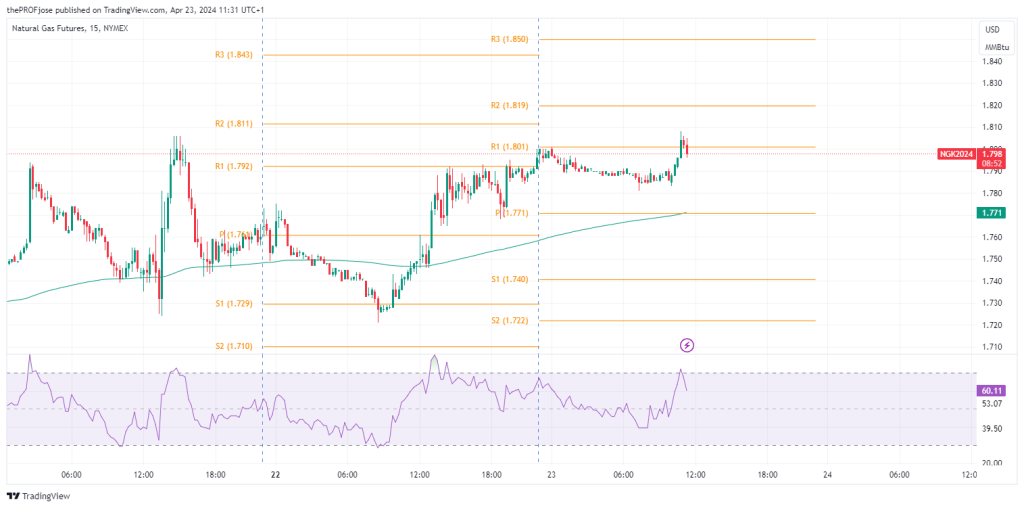
Given the overbought RSI, it’s prudent to hold off on new buys and observe the market response at the current resistance level. Should the price close below the pivot point, it can serve as an extra confirmation for the bearish move.
Natural Gas Fibonacci Key Price Levels 23/04/2024
Short-term traders planning to invest in NG today should keep a close eye on the following key price levels for the day:
| Support | Resistance |
| 1.740 | 1.801 |
| 1.722 | 1.819 |
| 1.692 | 1.850 |
Related Articles:
Risk Disclosure: The information provided in this article is not intended to give financial advice, recommend investments, guarantee profits, or shield you from losses. Our content is only for informational purposes and to help you understand the risks and complexity of these markets by providing objective analysis. Before trading, carefully consider your experience, financial goals, and risk tolerance. Trading involves significant potential for financial loss and isn't suitable for everyone.


